When To Use Call Events
- Use Call Events when you need event-by-event debugging.
- Use Call History when you want transcripts, recordings, and call-level review.
- Use Agent Review when you are managing flagged issues and team follow-up.
Open Call Events
- Open
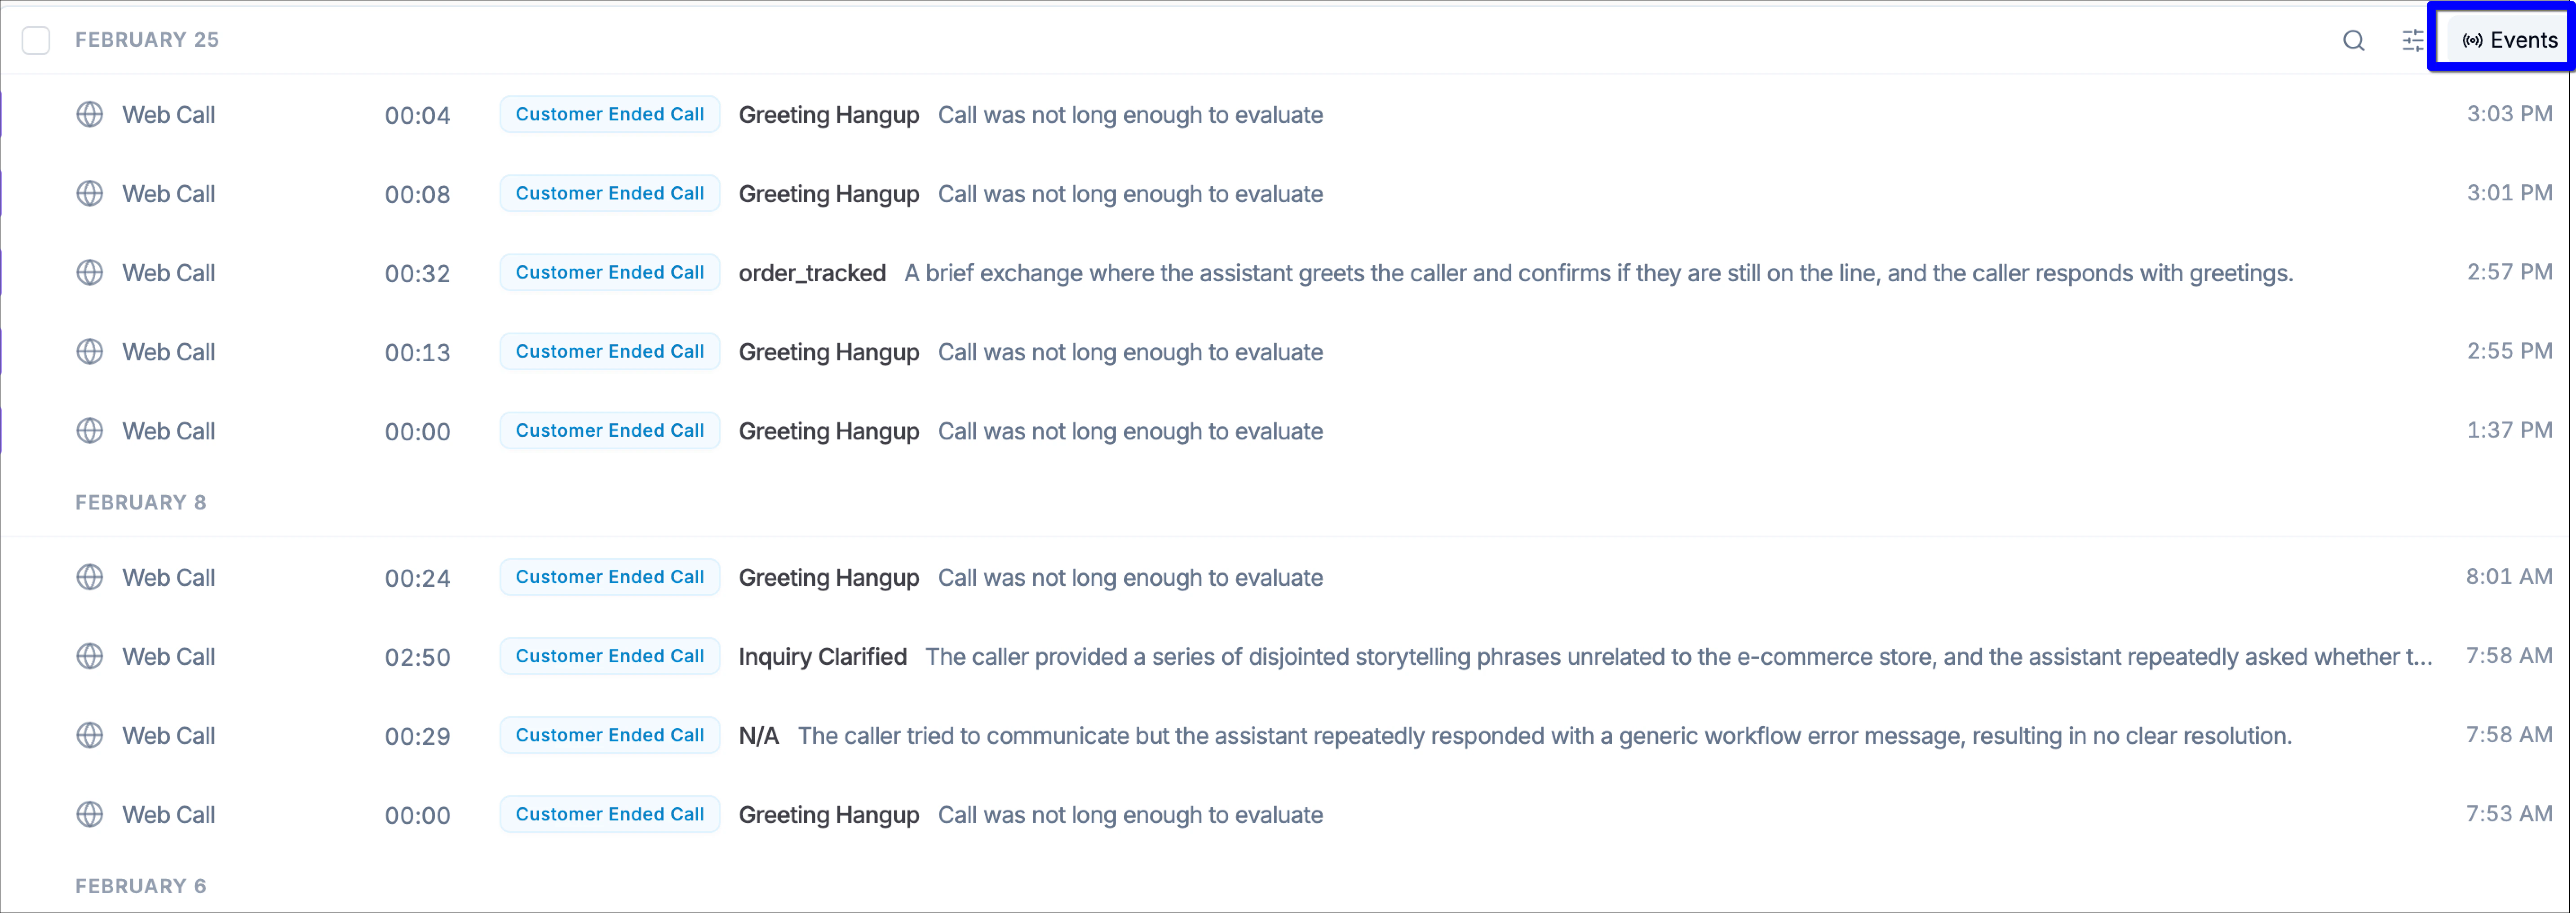
/event/{agentId}from the left navigation panel under Call Events. - If you are already in Call History, you can also use the Events button to jump to the same surface.
- Use Refresh to load the latest event data before starting your review.
- Confirm whether an action ran successfully
- Identify failed workflow actions
- Review events by Pre Call, Live Call, or Post Call
- Find slow events using execution time
- Inspect specific events tied to one Call ID
- Review integration behavior
- Inspect code block input and output
- Understand transfer and telephony behavior step by step
Page layout
The page is organized into the following main areas:Search Table Data
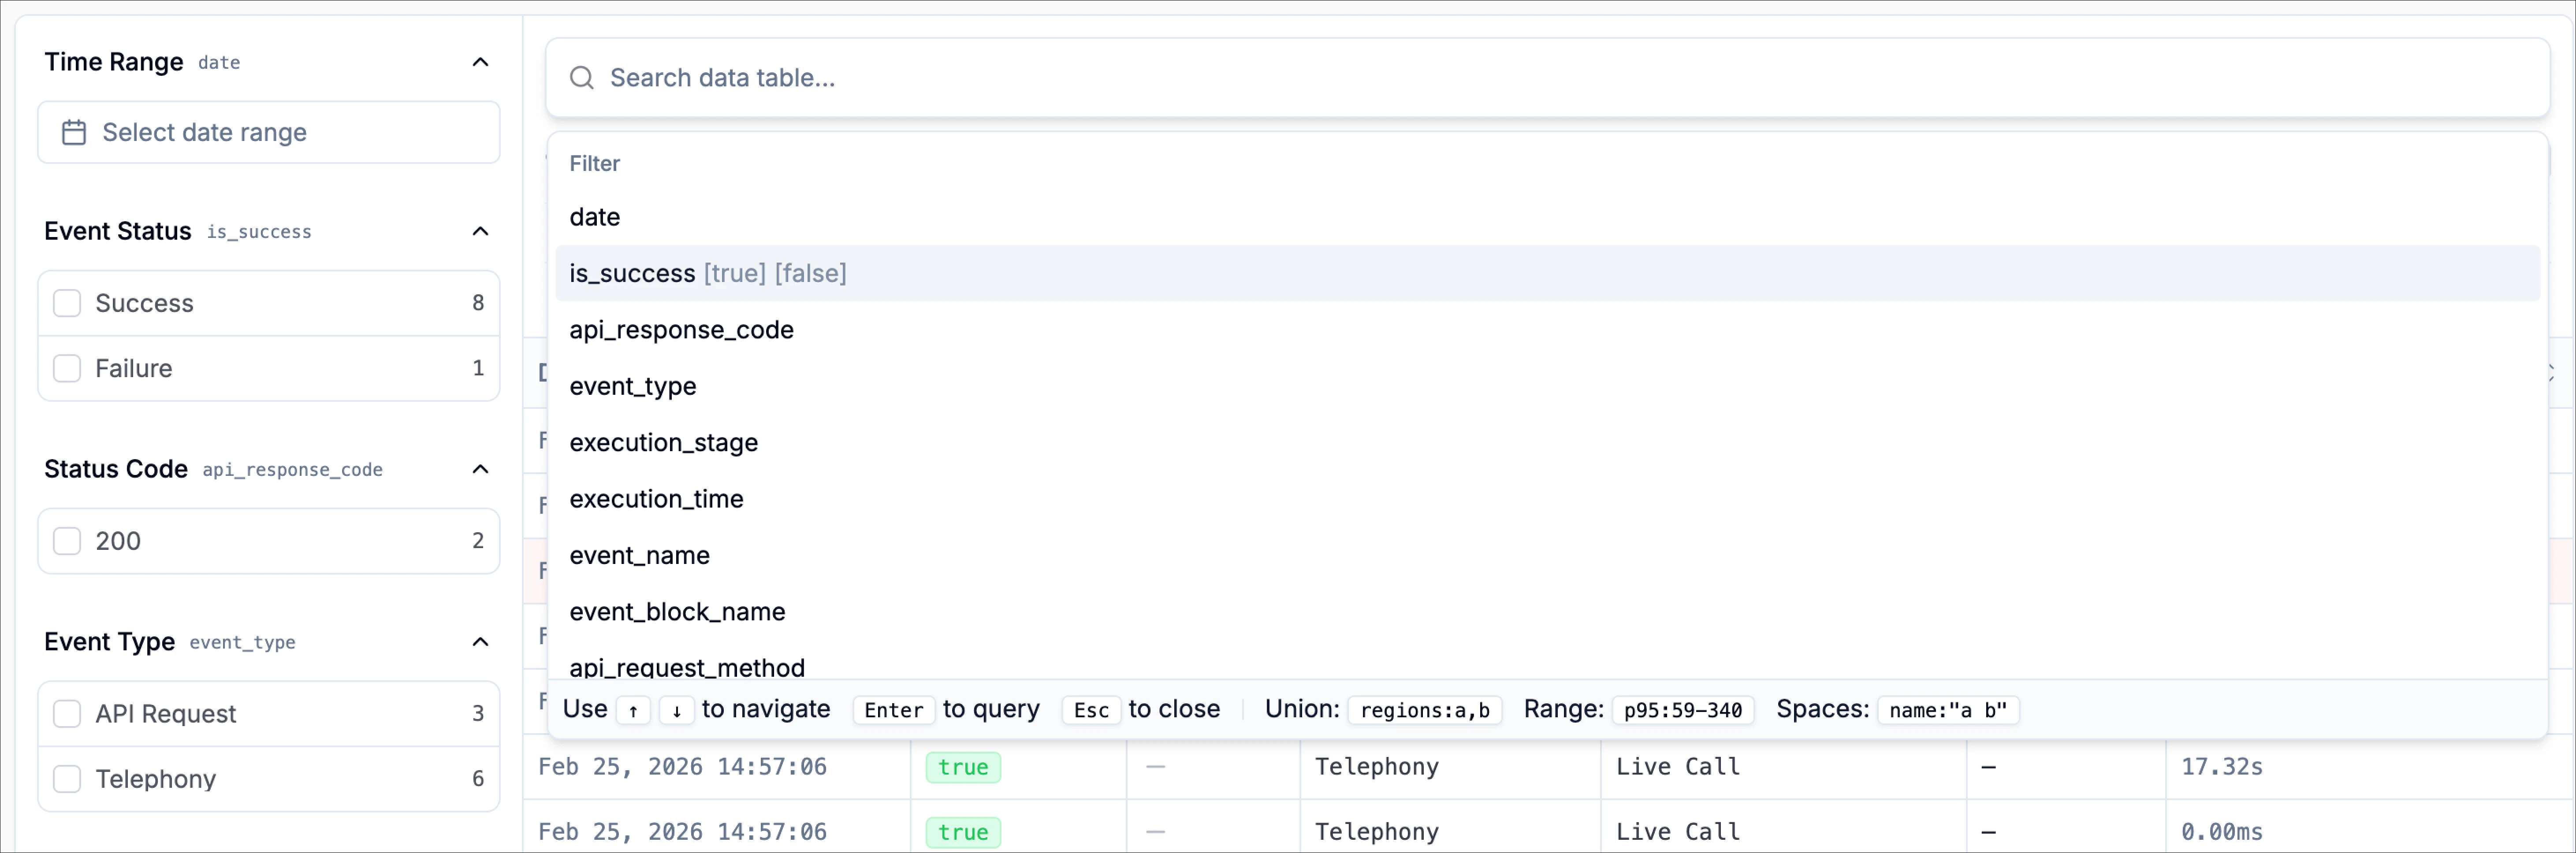
The search data table field lets you quickly find and filter event records without manually expanding each filter section in the left panel. This is useful when you already know the type of data you want to inspect, such as a specific event type, status code, execution stage, or event name, and want to narrow the table faster. As you type in the search bar, Phonely displays matching filterable fields and values in a suggestion panel. For example, you may see searchable options such as:Show options
Show options
dateis_successapi_response_codeevent_typeexecution_stageexecution_timeevent_name
Side Panel
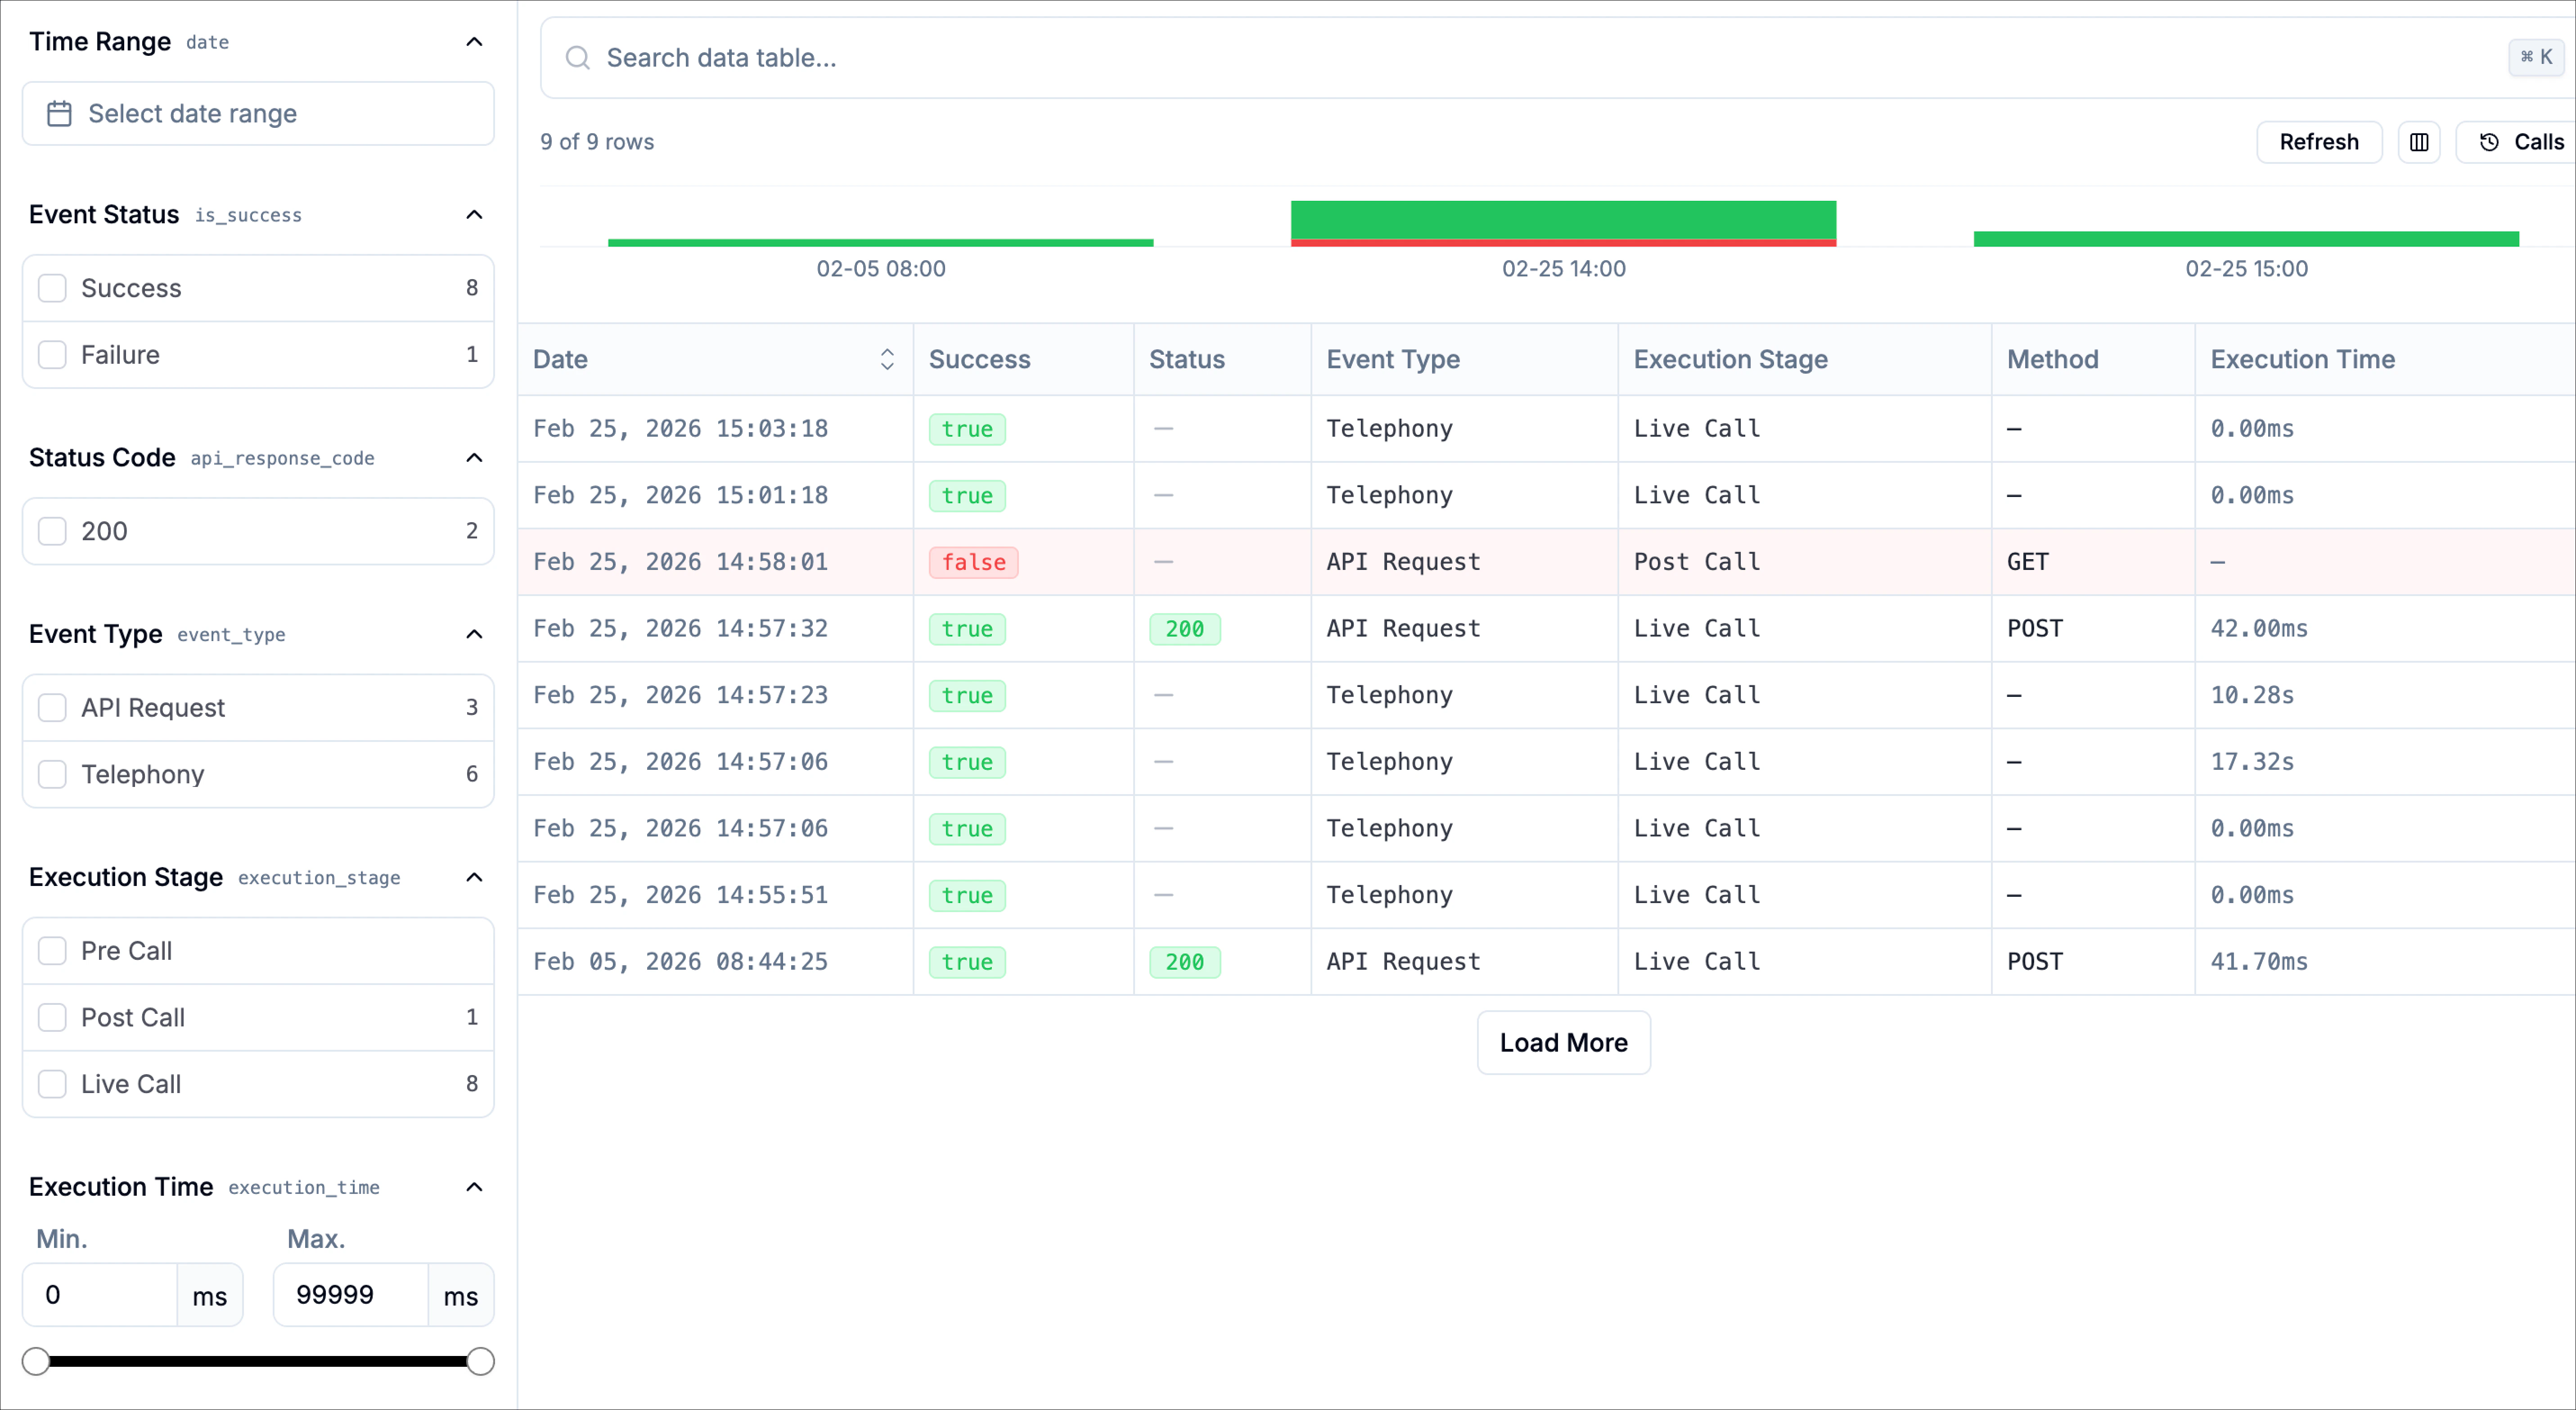
The left-side panel provides collapsible filter sections that help you narrow down and isolate specific events quickly. These filters make it easier to focus on exactly what you need when troubleshooting or analyzing call behavior. Available filter options typically include:- Time Range – View events within a specific date and time window.
- Event Status – Filter by success, failure, or other execution outcomes.
- Status Code – Narrow results by specific HTTP response codes.
- Event Type – Show only certain types of events, such as Telephony, API Request, or Code.
- Execution Stage – Filter based on where the event is in its lifecycle (e.g., started, completed).
- Time – Sort or refine events based on their execution timestamps.
Events Table
The main events table displays all event records that match your selected filters. It provides a structured overview of what occurred during the call, allowing you to quickly scan and identify relevant activity. Common columns in the table include:- Event name & date – The name of the event and the exact timestamp when it occurred.
- Success – Indicates whether the event completed successfully.
- Status – Shows the overall outcome or state of the event.
- Event type – Identifies the category of the event (such as Telephony, API Request, or Code).
- Execution stage – Displays where the event is in its lifecycle (for example, started or completed).
- Method & execution time – For applicable events, shows the method used and how long the action took to execute.
Event types
Call events is not limited to API requests. It captures multiple types of system-level actions that occur during a call, giving you full visibility into how your workflow executed behind the scenes. Common event types include:Telephony
Actions related to call handling, such as dialing, connecting, transferring, or ending a call.
API Request
Outbound or inbound requests to external systems, including status codes, response times, and success or failure details.
Code
Execution of custom code blocks within your workflow, useful for debugging logic or data transformations.
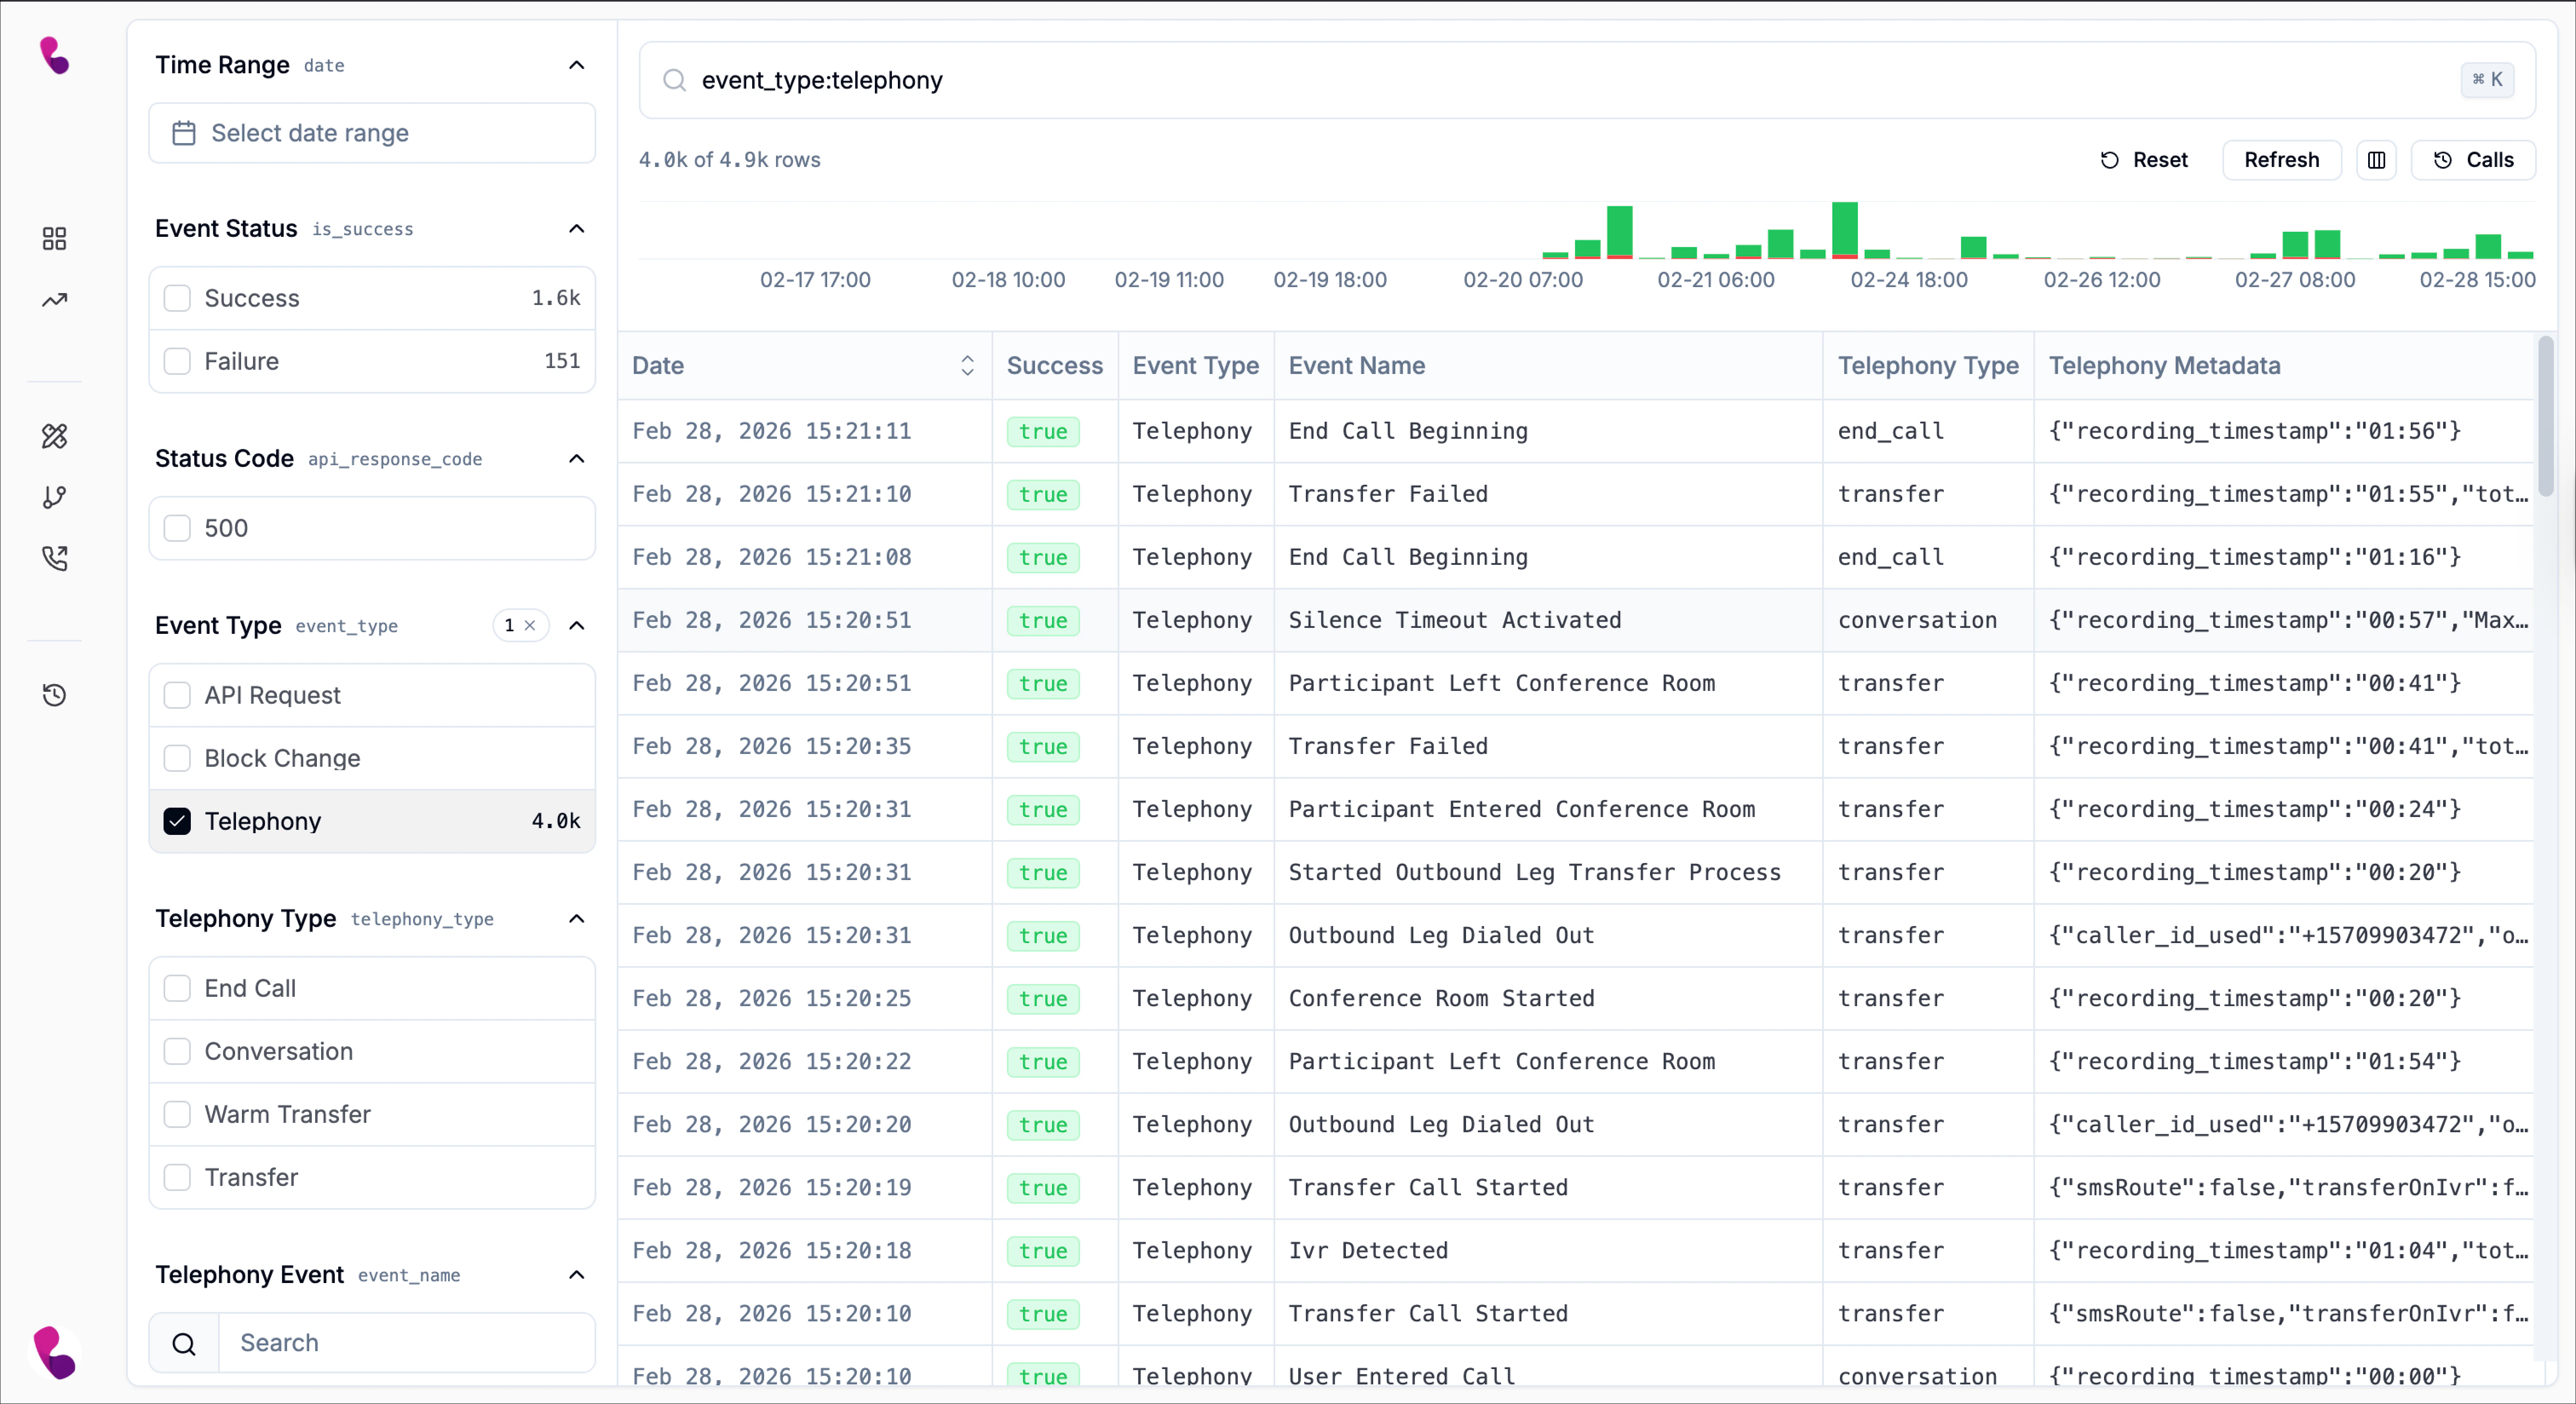
Telephony events
Telephony events record activity handled directly by the call system, including how the call was connected, routed, transferred, or ended. These events help you understand what occurred at the infrastructure level during the conversation. They are especially useful when troubleshooting call routing issues, investigating unexpected disconnections, or verifying whether a transfer was successfully completed. Common examples of telephony event names include:- End call beginning
- Transfer failed
- Silence timeout activated
- Participant left conference room
- Participant entered conferencerRoom.
- Started outbound leg transfer process
- Outbound leg dialed out
- Conference room started
- Transfer call started
- IVR detected
- User entered call
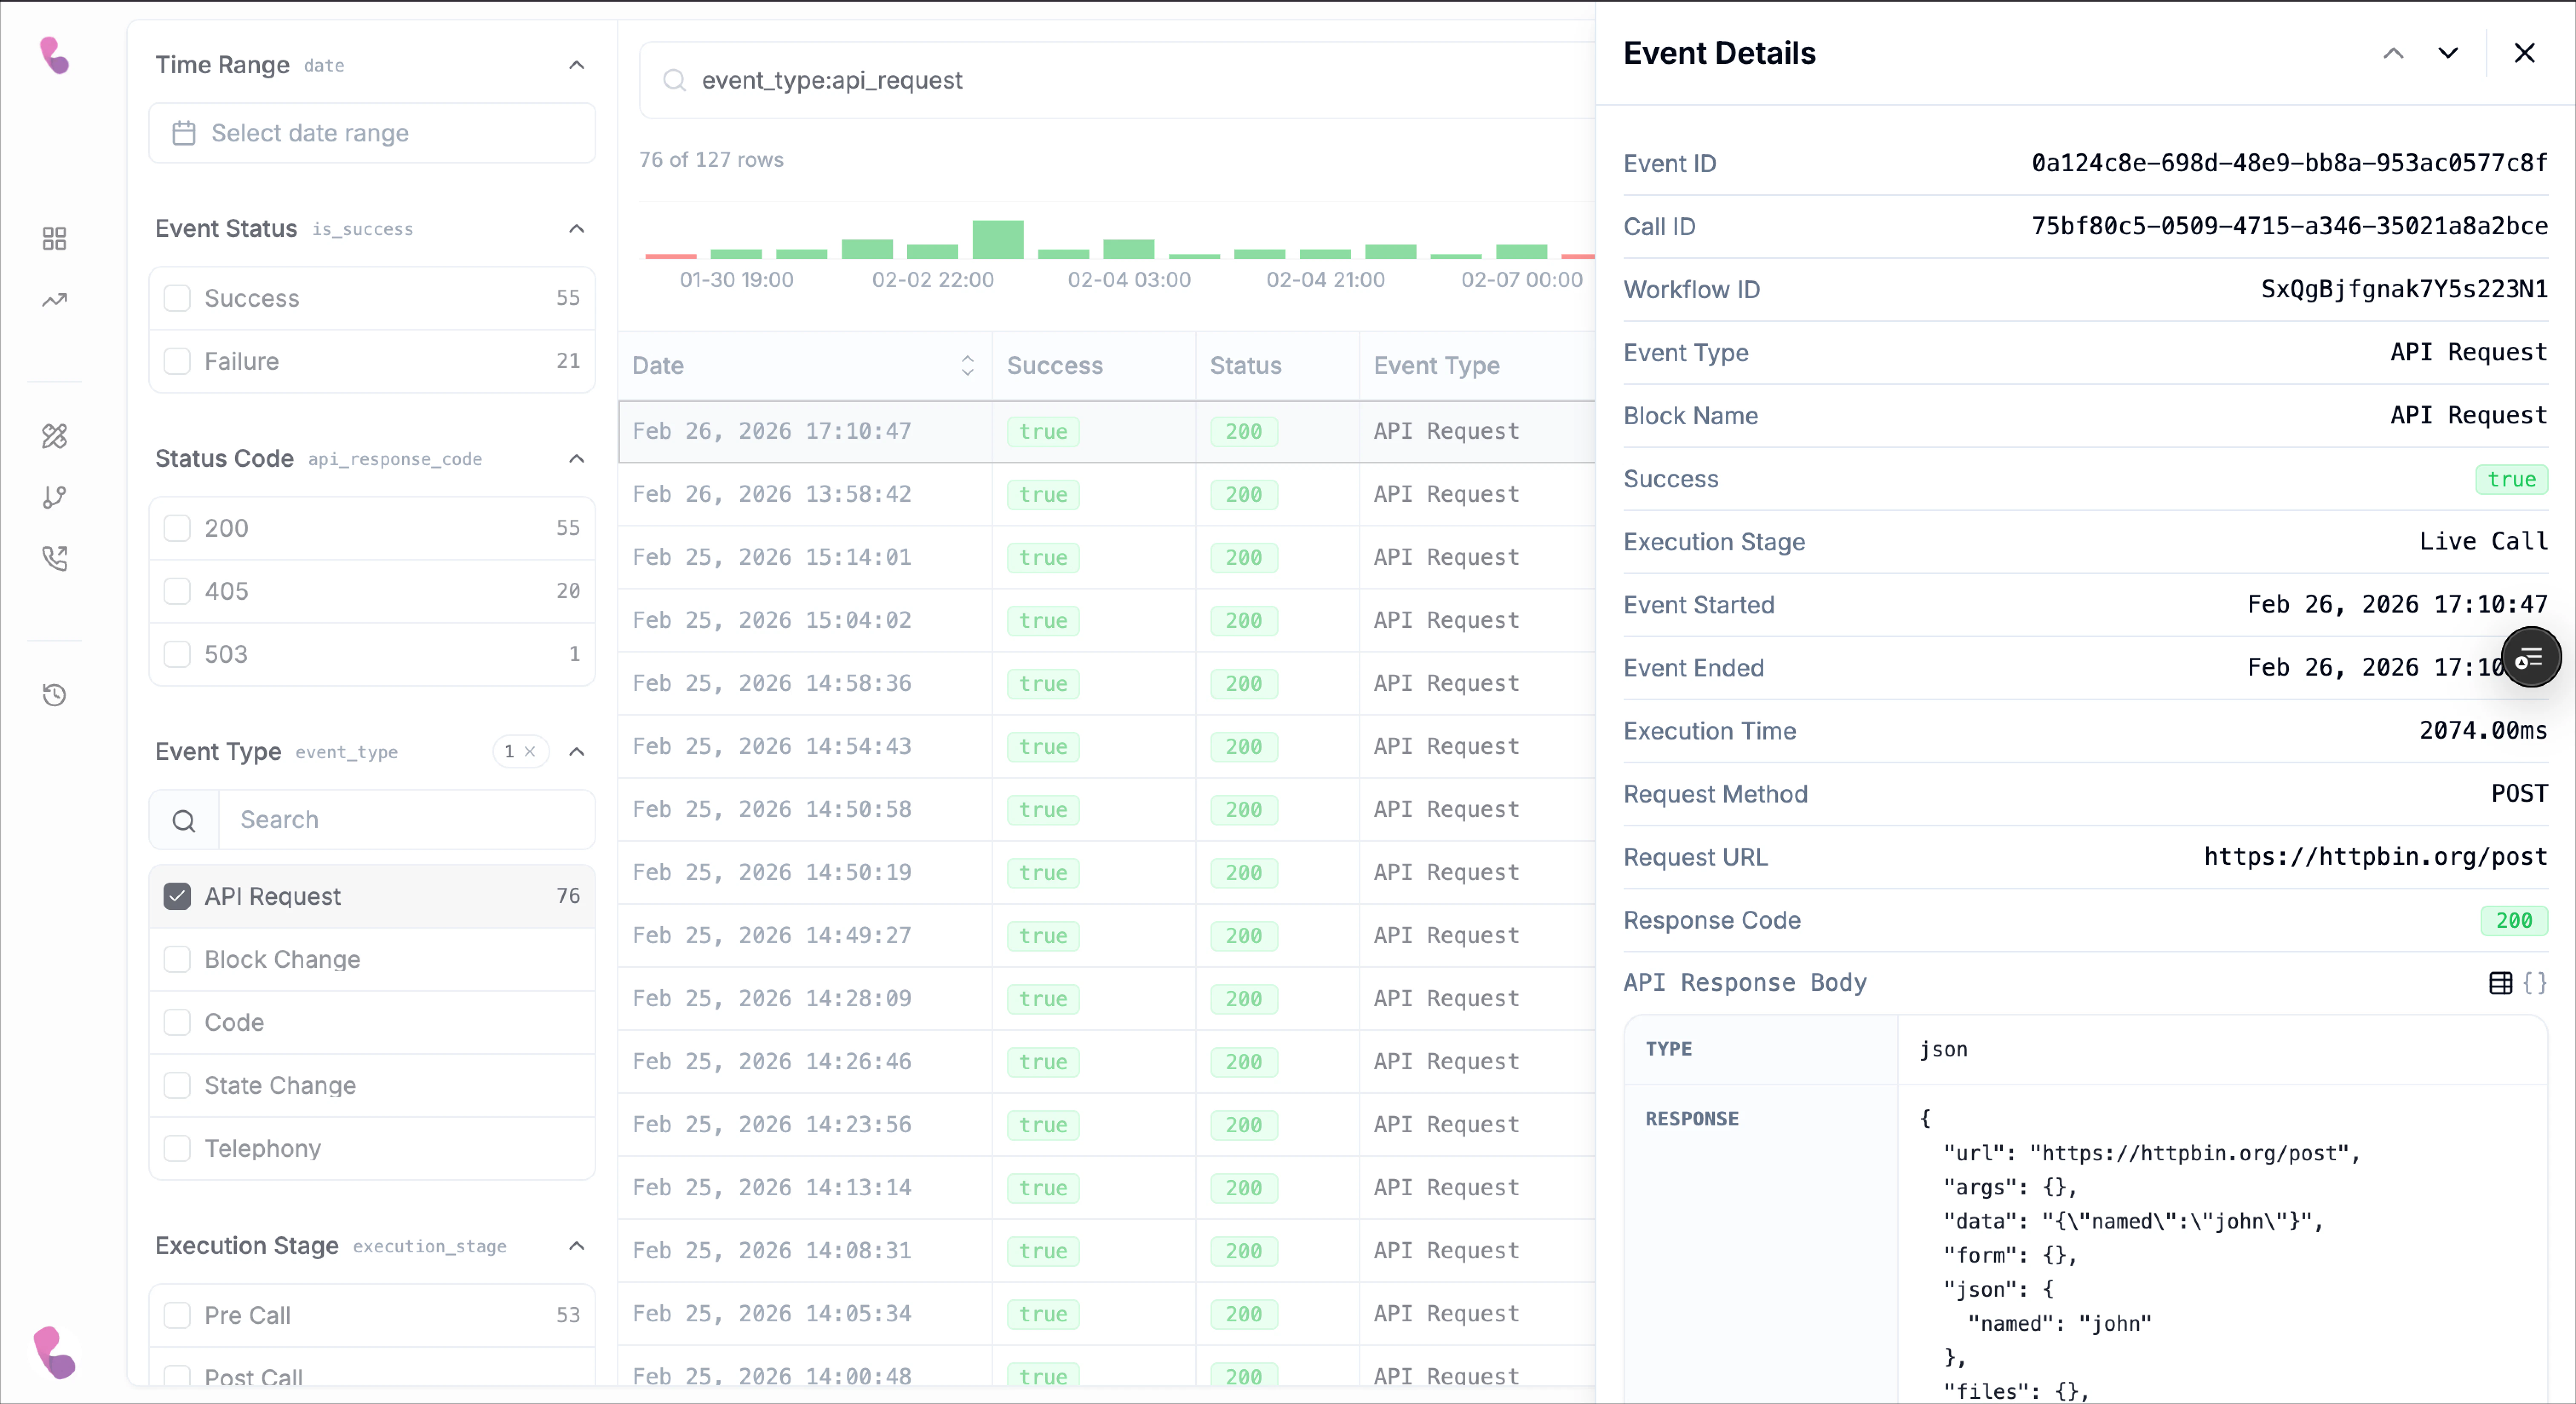
API Request Events
API Request events give you visibility into outbound calls your workflow makes to external systems. They allow you to confirm whether a request was sent successfully, how long it took, and what response was returned. For each API Request event, the table and detail view can include information such as:- Status – Indicates whether the request succeeded or failed.
- Method – The HTTP method used (for example, GET, POST, PUT, or DELETE).
- Execution Stage – Shows whether the request is starting, in progress, or completed.
- Execution Time – The total time taken for the request to execute.
- Request URL – The endpoint that was called.
- Response Code – The HTTP status code returned by the external service.
- API Response Body – The payload returned in the response.
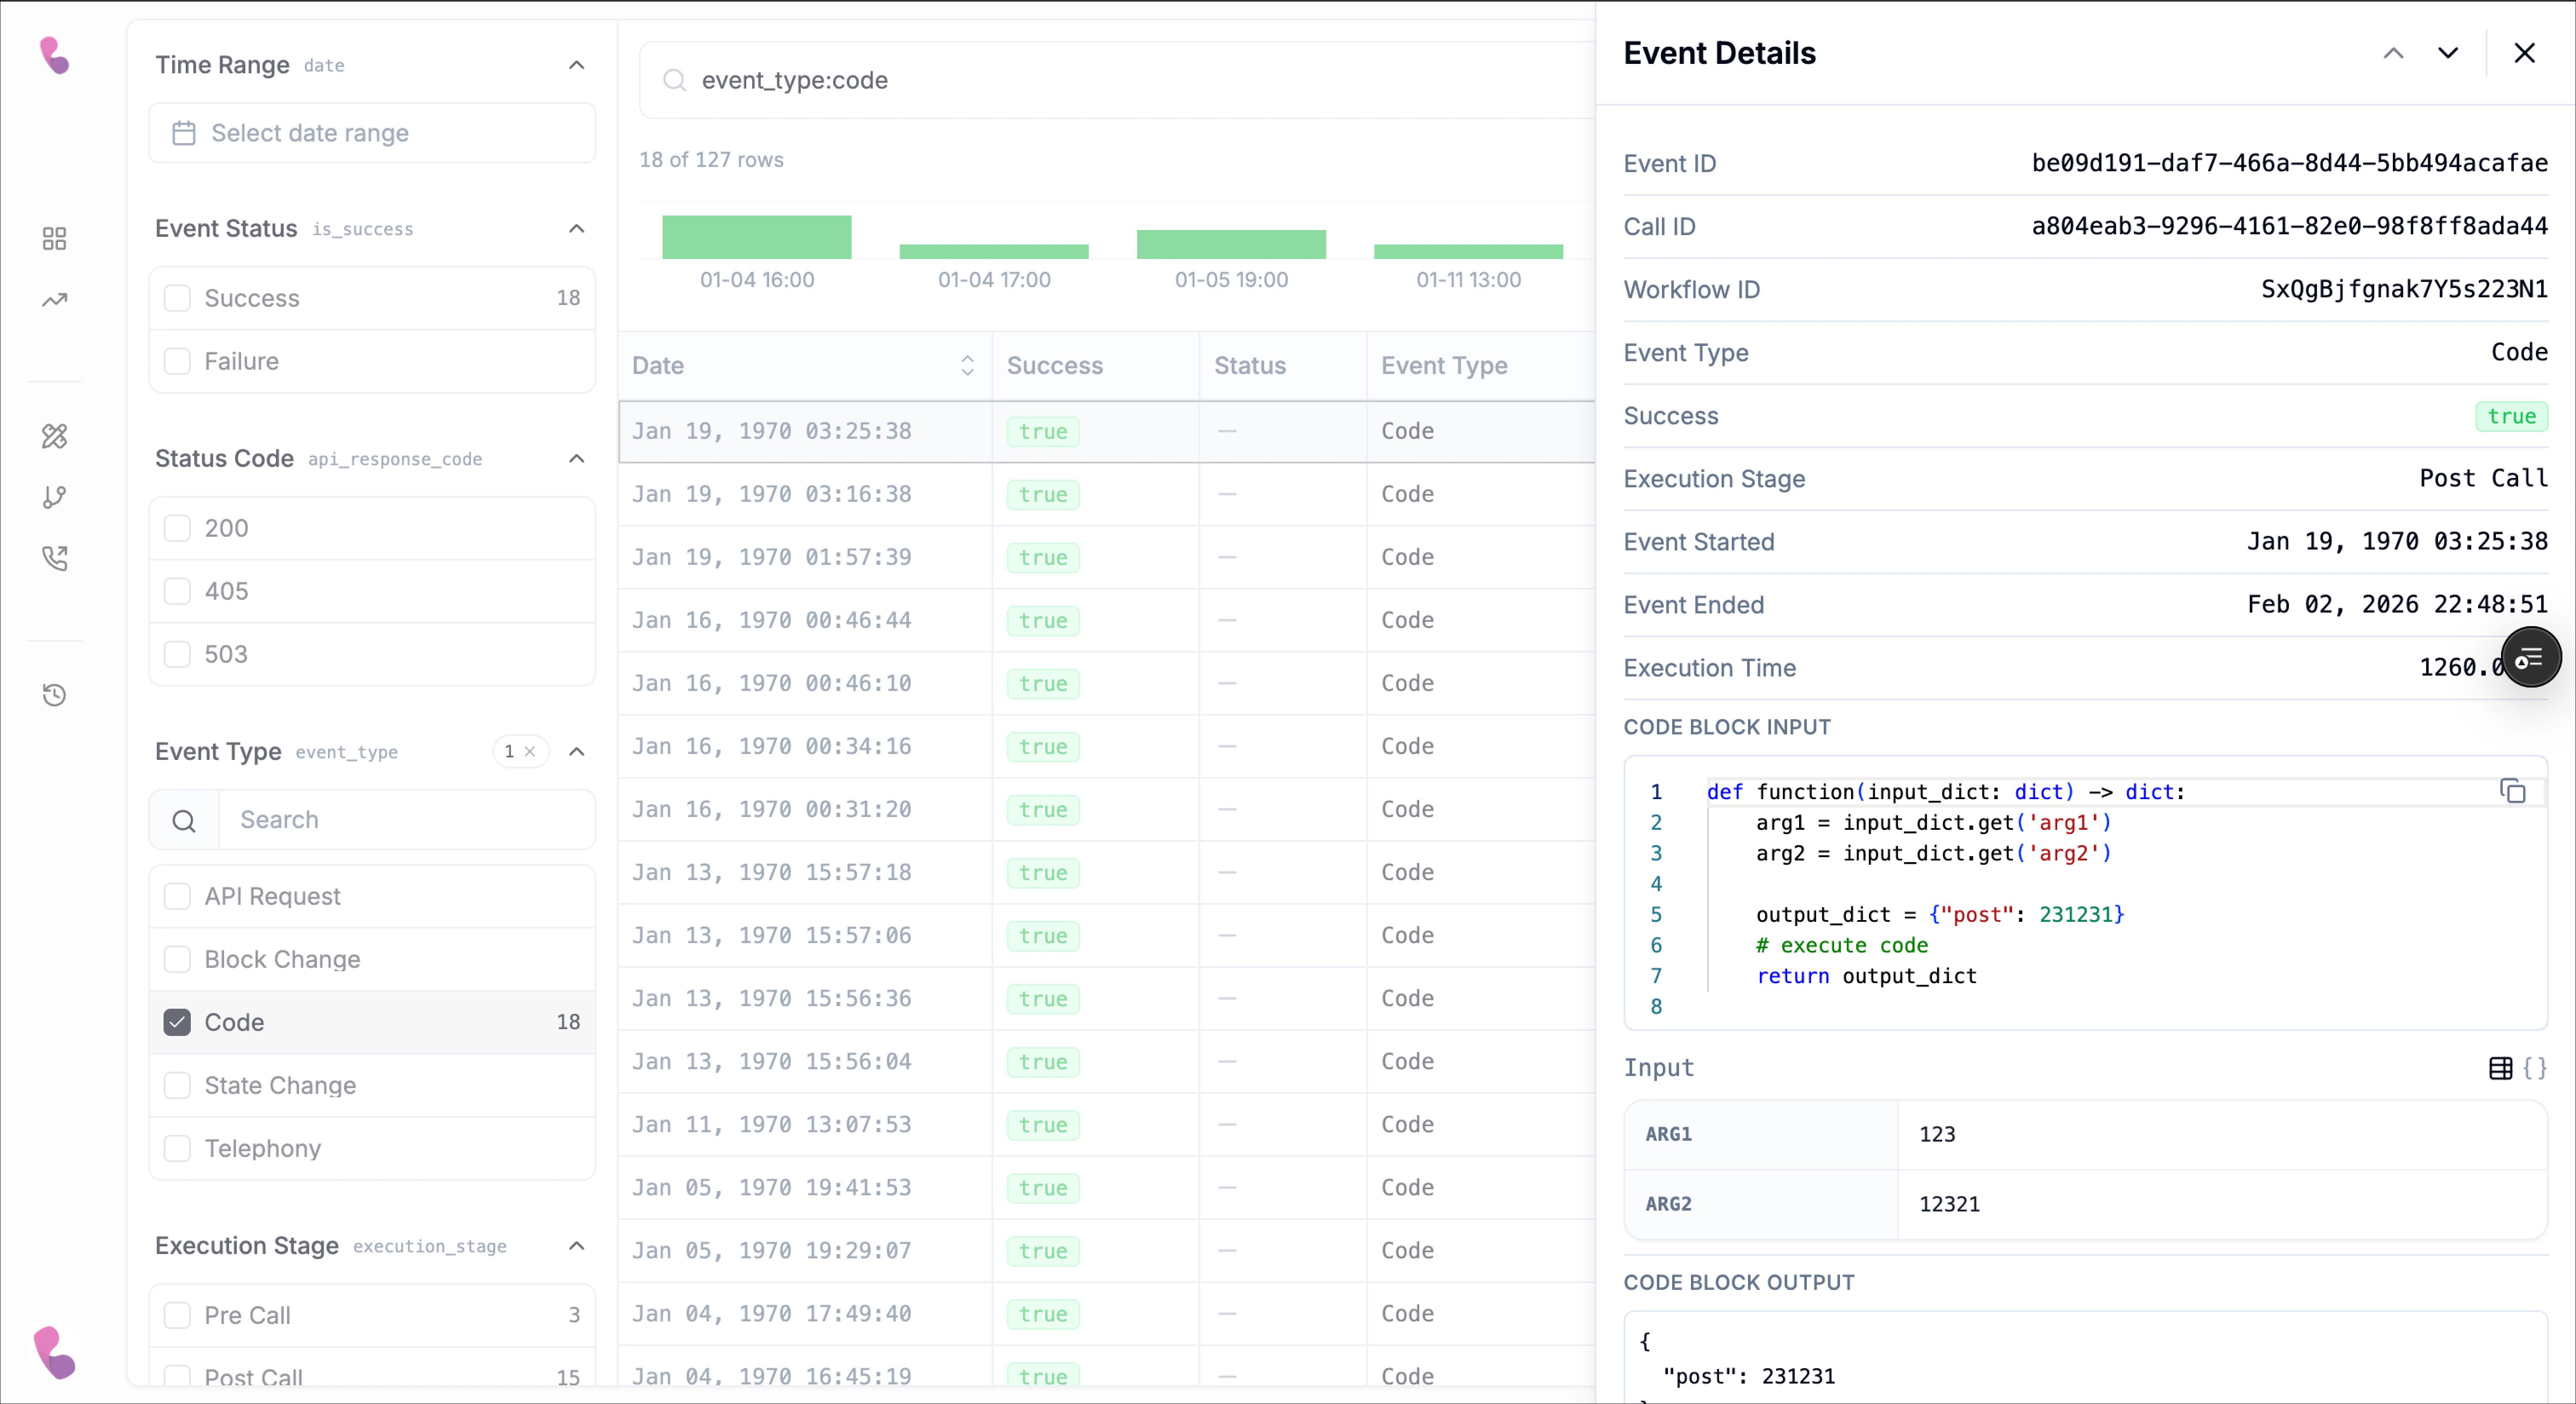
Code events
Code events give you visibility into what happened inside a code block during execution. They allow you to inspect how inputs were processed, how long the logic ran, and what output was produced. The event detail panel typically includes:- Event Type – Identifies the action as a code execution.
- Execution Stage – Indicates whether the code is starting, running, or completed.
- Execution Time – Shows how long the code block took to run.
- Code Block Input – Displays the data passed into the code block.
- Input – The evaluated variables or payload at runtime.
- Code Block Output – The result returned after the logic was executed.

View Event Details
The event details panel gives you the full record for a selected event. It is the most detailed view on the call events page and is especially useful when you need to trace what happened, confirm whether an action ran successfully, and inspect the exact data that was captured during execution. To open it, click any row in the events table. The panel opens on the right side of the page and updates based on the event you selected. Because different event types record different kinds of data, the fields shown in the panel will vary. However, all event details are built around the same goal: helping you understand what happened, when it happened, and what data was involved.Common event fields
Most events include a shared set of top-level fields that help identify and trace the record:- Event ID - A unique identifier for the specific event record.
- Call ID - The unique ID of the call this event belongs to. This is useful when you want to correlate several events from the same call.
- Workflow ID - The workflow associated with the event execution.
- Event Type - The category of event that occurred, such as API Request, Code, or Telephony.
- Block name - The workflow block that generated the event, when applicable. This is especially useful for action blocks such as API Request blocks.
- Success - Indicates whether the event completed successfully (
true) or failed (false). - Execution stage - Shows when the event happened in the call lifecycle, such as: pre call, live call or post call.
- Event started - The timestamp when the event began.
- Event ended - The timestamp when the event completed.
- Execution time - The total time taken to execute the event.
API Request event details
When the selected event is an API request, the details panel expands to include request and response information. This is the most useful view when you want to troubleshoot integrations or verify that your workflow called the correct endpoint and received the expected response. In addition to the shared fields above, API Request events can include:- Request method - The HTTP method used by the request, such as
GET,POST,PATCH, orPUT - Request URL - The endpoint URL that the workflow called.
- Response code - The returned HTTP status code, such as
200,405,500, or503. - API Response body - The response payload returned by the external service.
- The type of returned data
- The actual response body
- A structured/table-like view
- A raw object/JSON-style view
Request method and Request URL
Confirm the request was sent to the correct endpoint using the intended method.
Code event details
When the selected event is a code event, the details panel focuses on the code execution itself. This makes it possible to inspect the exact logic that ran and compare the input values against the final output. Code events include the common fields listed above, and may also include:- Code block Input - The actual code that was executed inside the block.
- Input - The values passed into the code block at runtime.
- Code block output - The final output returned by the code block.
- What code was executed
- What values the code received
- What output it produced
- Whether the output matched your expectations
Telephony event details
Telephony events focus on call-system behavior and call routing activity. These events are especially important for troubleshooting live call handling, transfers, end-call behavior, participant changes, and conversation state changes. Depending on the telephony event, the table and associated event record can include fields such as:- Event Name
- Telephony Type
- Telephony Metadata
- A transfer starting
- An outbound call dialing out
- A participant entering or leaving a conference room
- IVR detection
- Silence timeout activation
- End-call behavior starting
- Whether silence timeout was triggered
Customize the Events Table
The column/options menu (opened from the icon next to Refresh) lets you control what fields are available on the page and in what order they appear. This makes the Events page easier to use when you want to focus on a specific troubleshooting workflow. Use this menu to:- Search for a field/option quickly
- Show or hide columns using checkboxes
- Reorder fields using drag handles
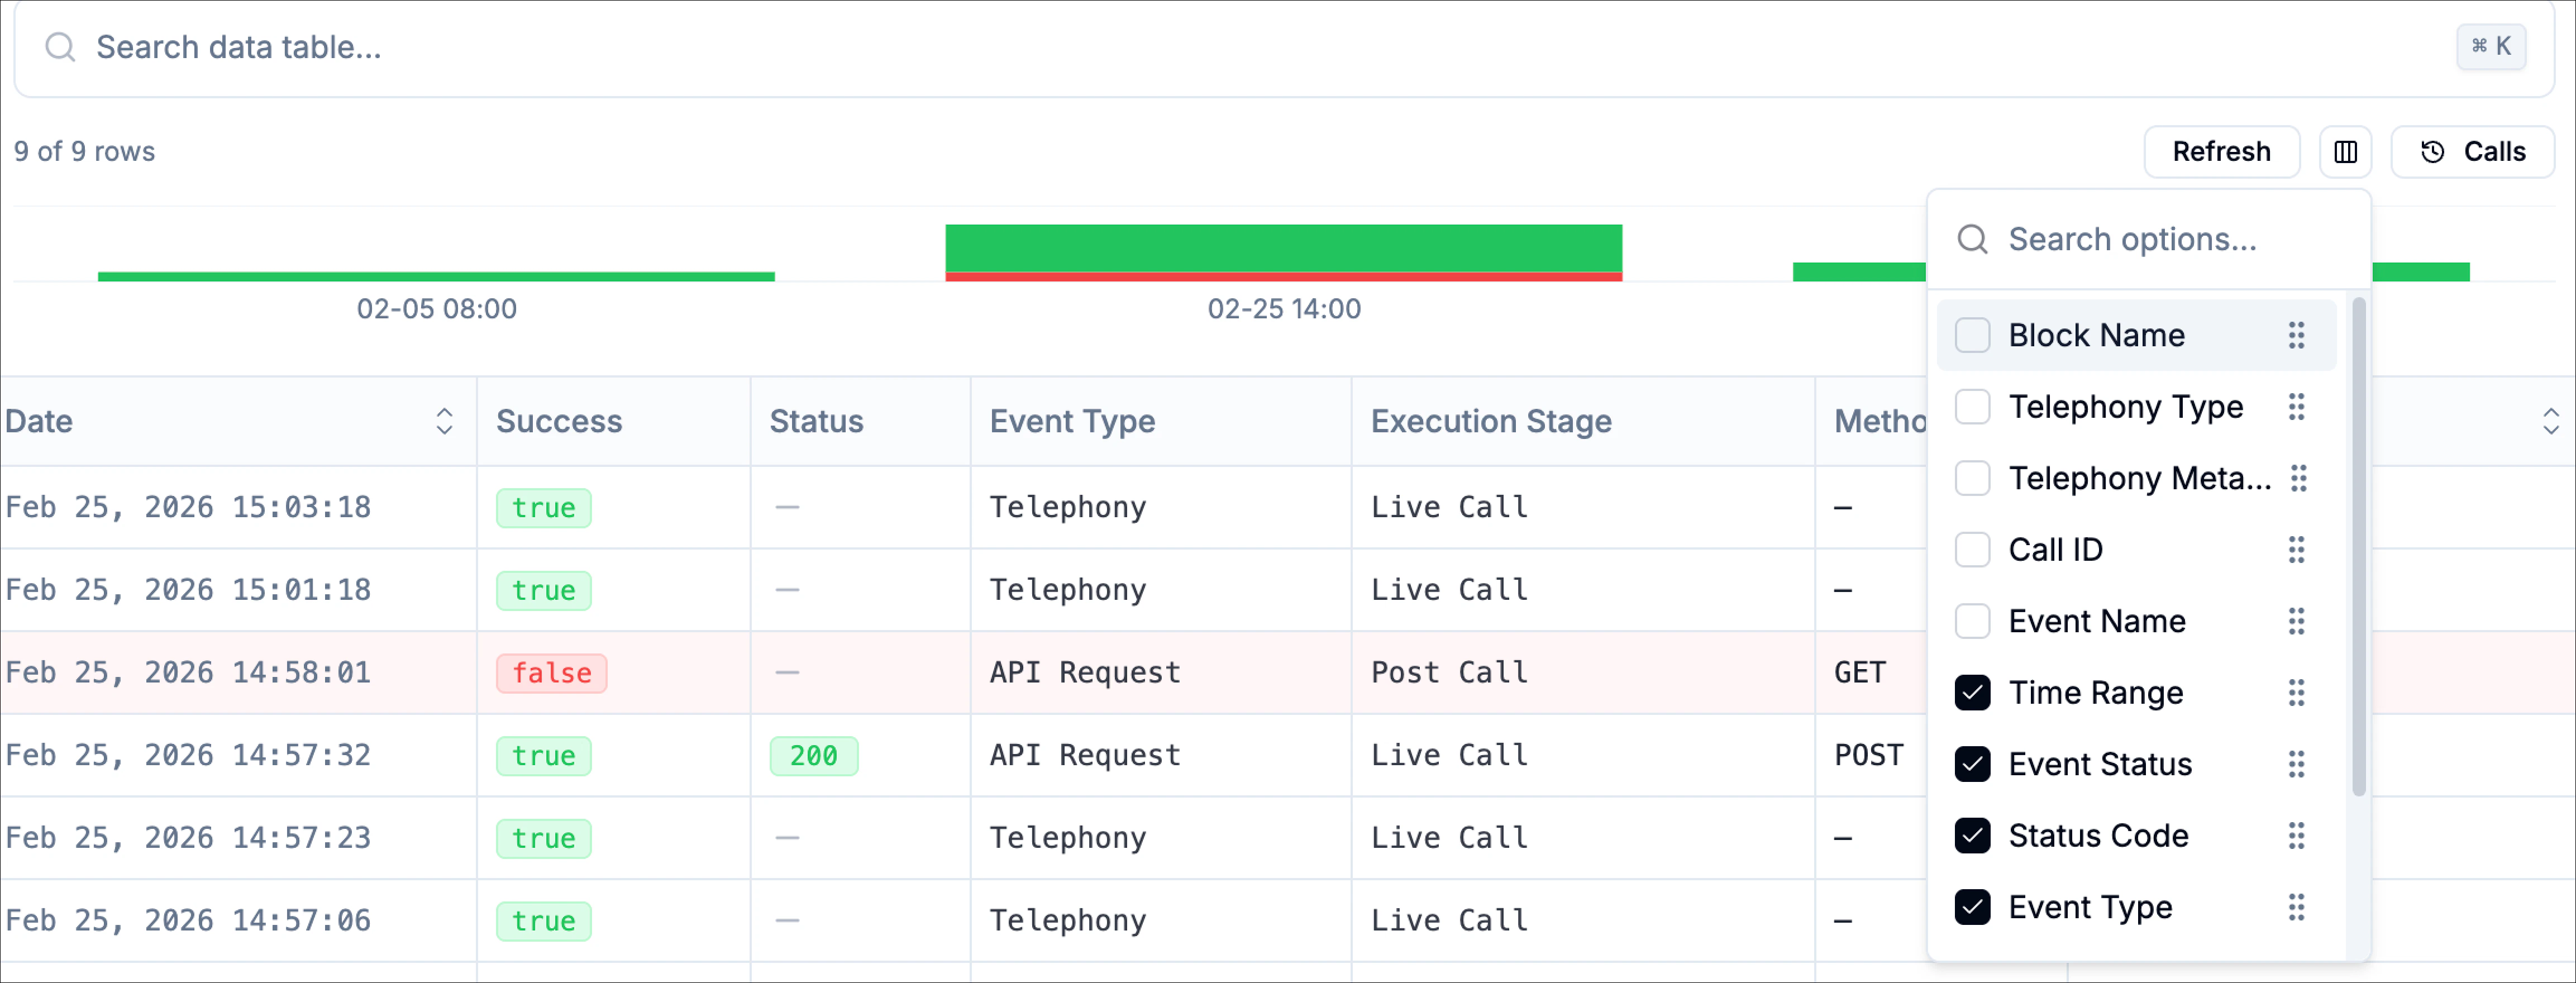
Show or hide fields
Each item in the list includes a checkbox.- Checked = the column is visible on the table
- Unchecked = the column is hidden from the table
Reorder fields
Each row in the options panel includes a drag handle (the dotted grip icon). Use it to drag items up or down and change the display order of the columns.Pagination / incremental loading
If more records exist than are currently shown, use Load More to fetch additional rows in the current filtered view.Sorting events
Some table headers like event time and date include sorting controls. Use these to sort events in ascending or descending order. Sorting allows you quickly answer questions like:- What are the newest events?
- Which events took the longest?
- When did failures happen in sequence?