What a data table view ?
A view is a saved table configuration. Each view includes:- A grouping, which determines how the rows are split
- One or more metric columns, which determine what each column calculates
- Optional targets for each metric, so you can compare results against a goal
Another might show success rate by day Another might show negative sentiment rate by hour Each of these is a separate saved view.
The page can also include a metric selector such as duration, depending on your current performance settings.
How the page is organized
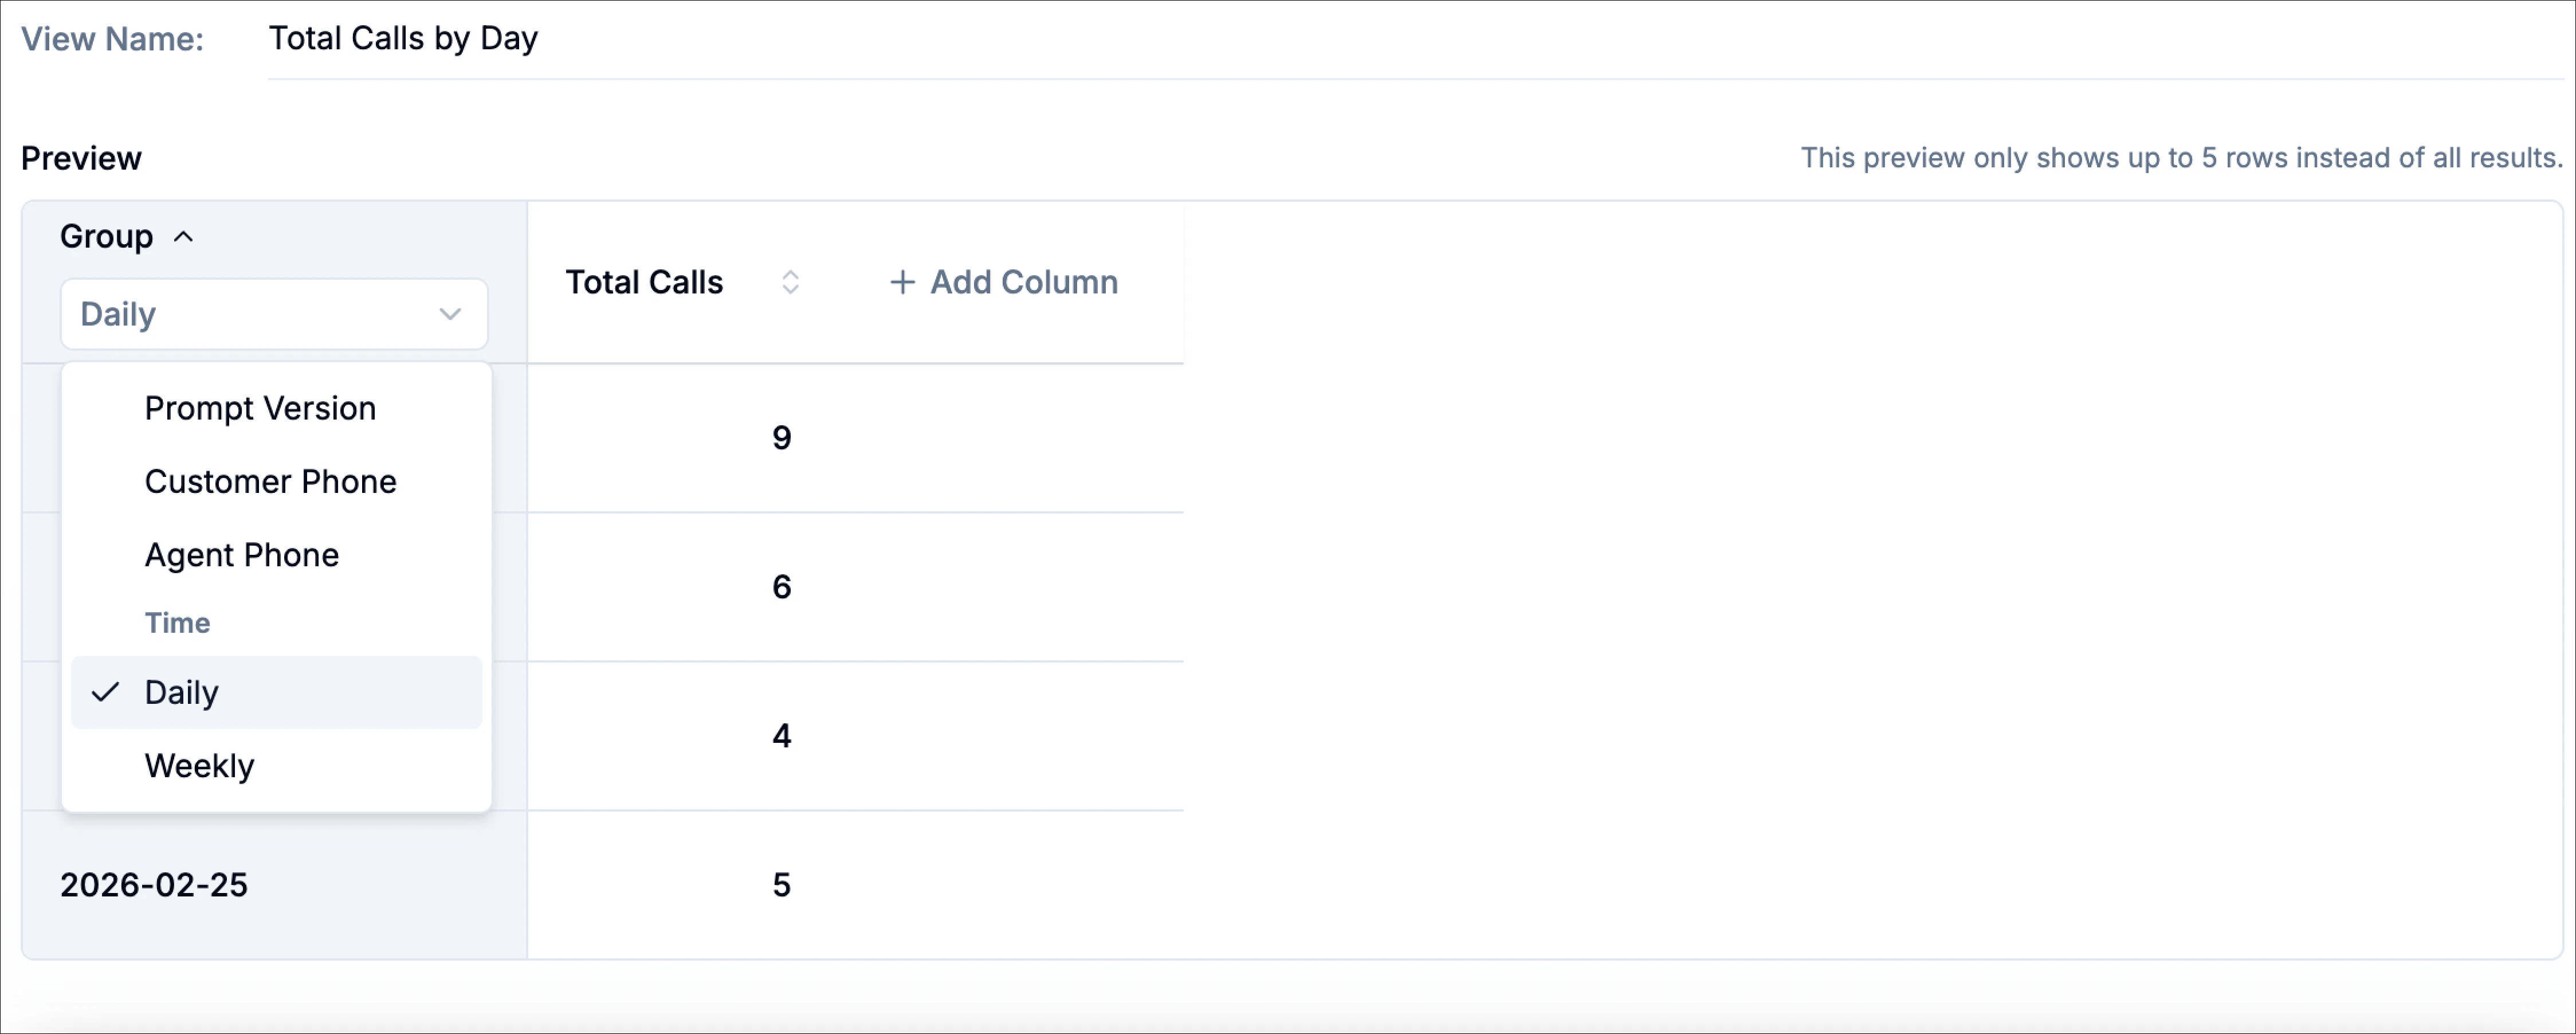
The data tables page is built around a saved view. At the top, you’ll see controls such as the date range and any global performance selector currently applied. Below that, the main data table area includes the active view tab, an Add view button, the Group selector, and the metric columns. The active view name appears as a tab. This makes it easy to keep several saved views and switch between them without rebuilding them each time. Inside the table, the first column is usually the grouping column. For example, if the grouping is Prompt Version, the first column lists values such asv2.4, v1.5 The remaining columns are metric columns, such as Total Calls or any custom formulas you add.
There is also an Add Column action in the table header. This is where you create new metrics.
Create a data view
When you click Add view, you can create a new view in two different ways. You can describe the view you want in plain language and use AI suggestions to generate a starting point, or you can choose to build the view manually. The AI-assisted flow is useful when you already know the question you want to answer but do not want to set up the table from scratch. In the Create Data View dialog, you can type a request like: Show daily total calls, success rate, and negative sentiment rate. You can also choose from suggested examples such as:- Show total calls by day
- Track appointment booked rate by week
- Compare sales vs appointment confirmed by day
- Show avg duration by customer phone number
- Show negative sentiment rate by hour
Build a view manually
If you want full control over how the table is set up, you can build a view manually instead of using the AI-generated suggestions. This is the best option when you already know how you want the rows to be grouped and which metrics you want to calculate. To start, open Data Tables and click Add view. In the Create Data View flow, choose Build Manually. This opens the manual builder, where you can define the view name, preview the table, choose a grouping, and add columns before publishing the view. At the top of the builder, enter a View Name. This is the label that will appear as the saved tab in data tables, so it should describe what the view is intended to show. For example, names like Total Calls by Day, Appointment Booked Rate by Week, or Negative Sentiment by Prompt Version make the purpose of the table clear.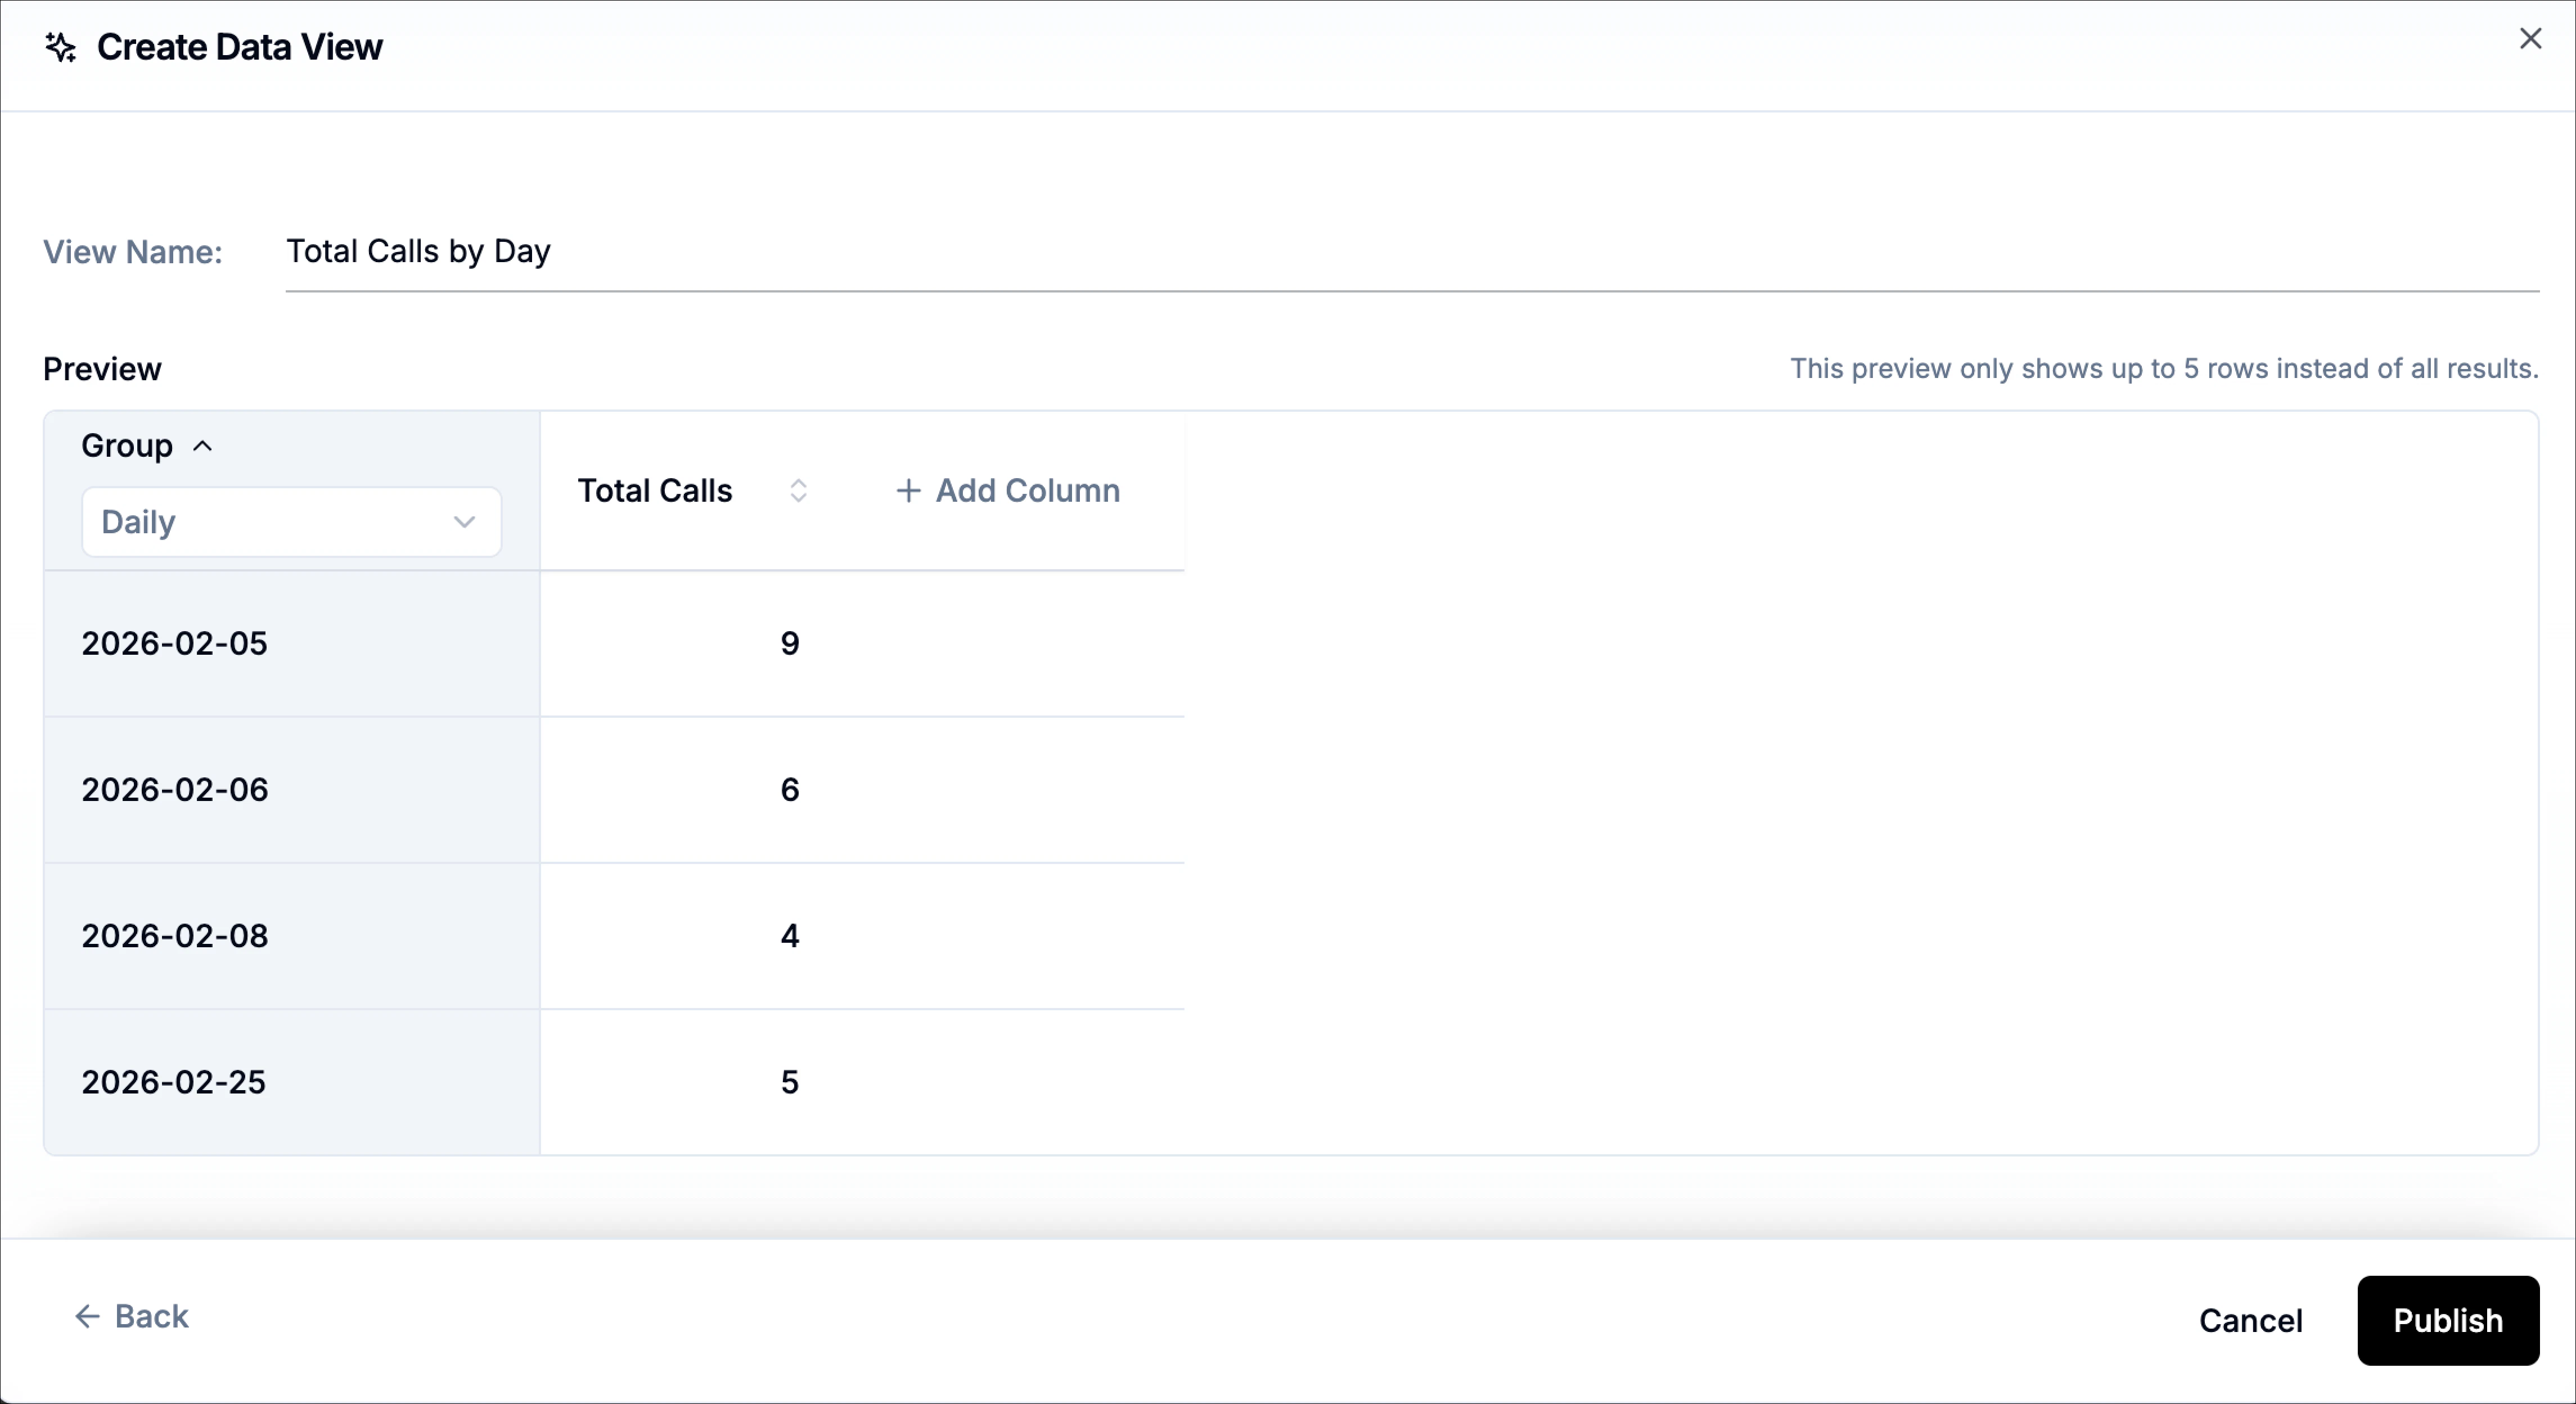
Metric Name
The metric name is the visible label of the column in the table. It should describe the value clearly enough that someone can understand it without reading the formula. This matters because a technically correct formula can still produce a confusing report if the column name is vague.Formula
The formula defines how the metric is calculated for each row group. This is the most important part of a metric column. The formula language supports arithmetic expressions and variable references, so you can calculate counts, percentages, ratios, and averages.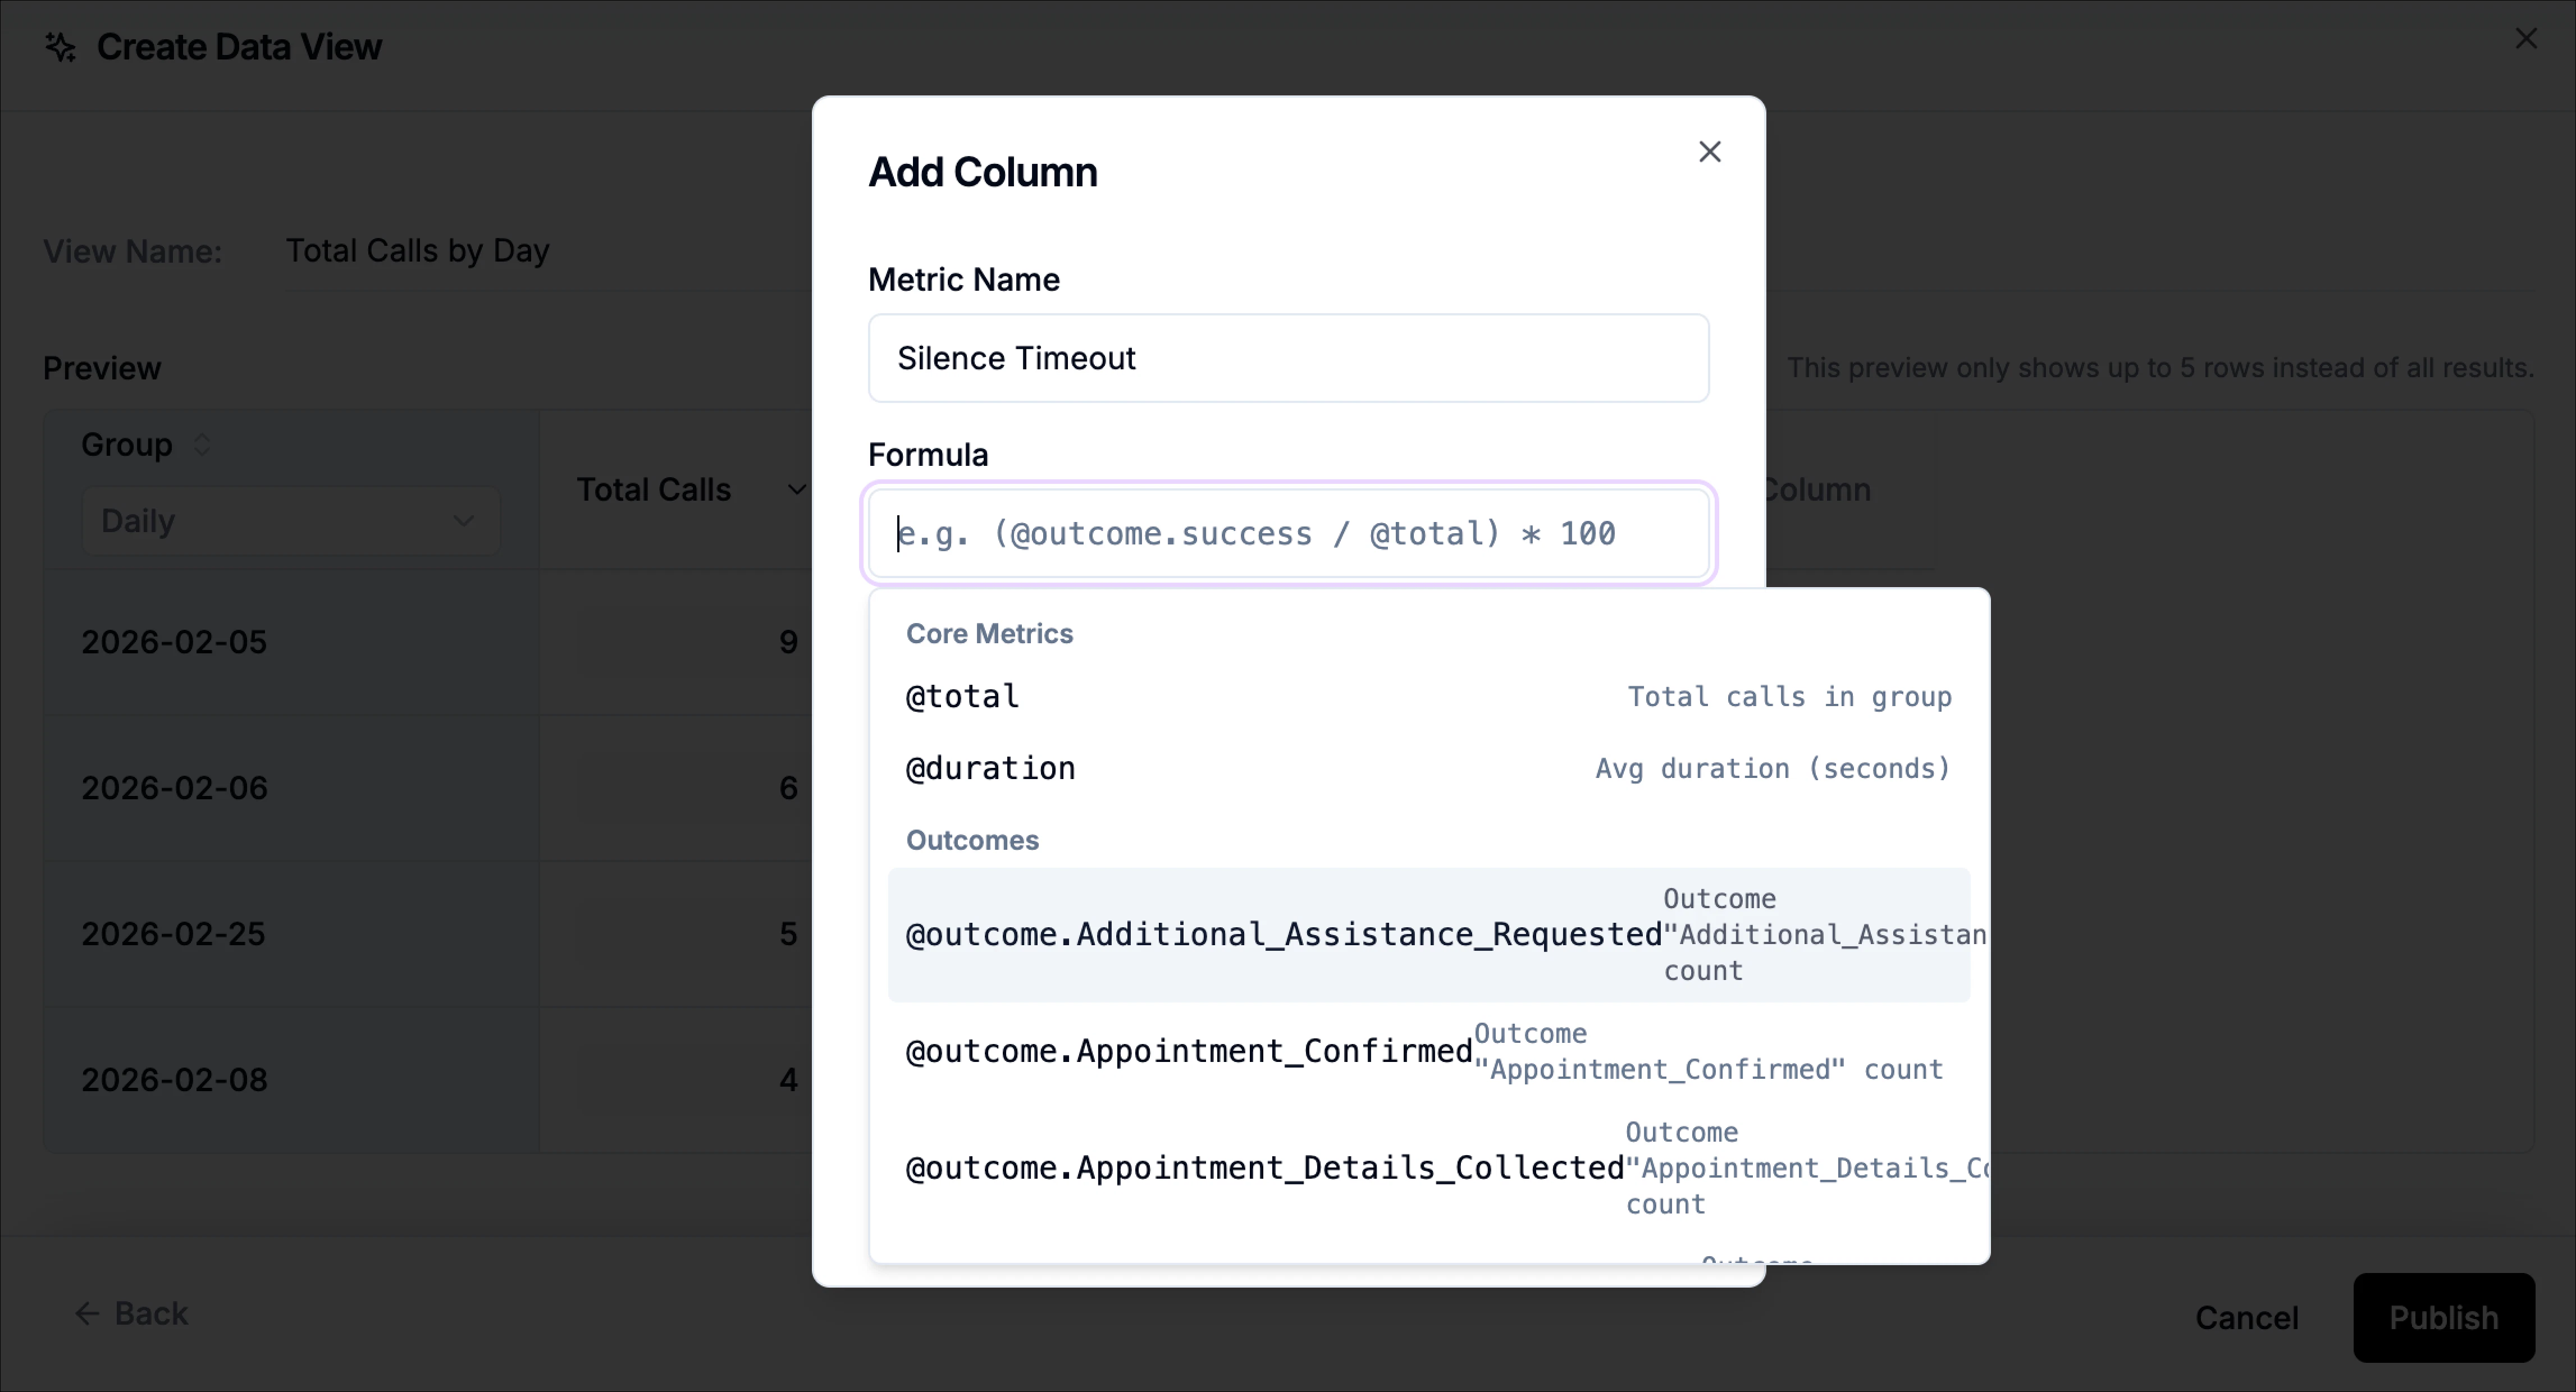
Operators
You can use:+add-subtract*multiply/divide()parentheses
Common Variables
The formula system includes built-in core variables. @total: Returns the total number of calls in the current row group. @duration: Returns the average call duration for the current row group, in seconds.Namespaced variables
Beyond core metrics, the system supports namespaced variables. These let you count calls within the row group that match a specific metadata category. Supported namespaces include:@outcome.<value>@topic.<value>@sentiment.<value>@ended_reason.<value>
Outcome variables
Outcome variables count calls that include a specific outcome from the agent’s latest published version. Only outcomes that exist in the latest published version appear in the formula picker. Examples include: Use these when you want to measure how often a specific workflow result appears.Topic variables
Topic variables count calls tagged with a specific call topic that is currently set for the agent. Only topics that are configured for the agent appear in the formula picker. Examples include: These are useful for analyzing caller intent, routing outcomes, or topic trends.Sentiment variables
Sentiment variables count calls by sentiment classification. Supported values include: These are especially useful for experience and quality monitoring.End reason variables
End reason variables count calls by how they ended. Examples include: These are useful when you want to monitor call completion patterns or operational failure modes.Excluding calls by metadata key
The formula system also supports exclusions using the-@{variable} pattern. This removes calls that contain the specified custom metadata key before the metric is calculated.
For example:
outcome.success metadata key before computing the metric.
Use exclusions when you want to remove a known subset of calls from the calculation rather than count them as part of the numerator or denominator.n.
Targets and KPI comparison
Targets are optional, but they are very useful when a metric represents a KPI rather than a descriptive value. When include target is enabled for a metric, you define a direction and a target value. Targets are optional, but they are important when a metric represents a KPI rather than just a descriptive value. A target includes two parts, the direction and the target value.Target direction
The direction tells the table how to interpret success. If the direction is Above (>=), the metric is considered green when the value is at or above the target.
Above (>=)
Use this when higher values are better.
Examples:
- Success rate should be above 75
- Appointment booked rate should be above 20
<=)
Use this when lower values are better. If the direction is Below (<=), the metric is considered green when the value is at or below the target.
Examples:
- Negative sentiment rate should be below 10
- Avg duration (min) should be below 4
- Voicemail rate should be below 5
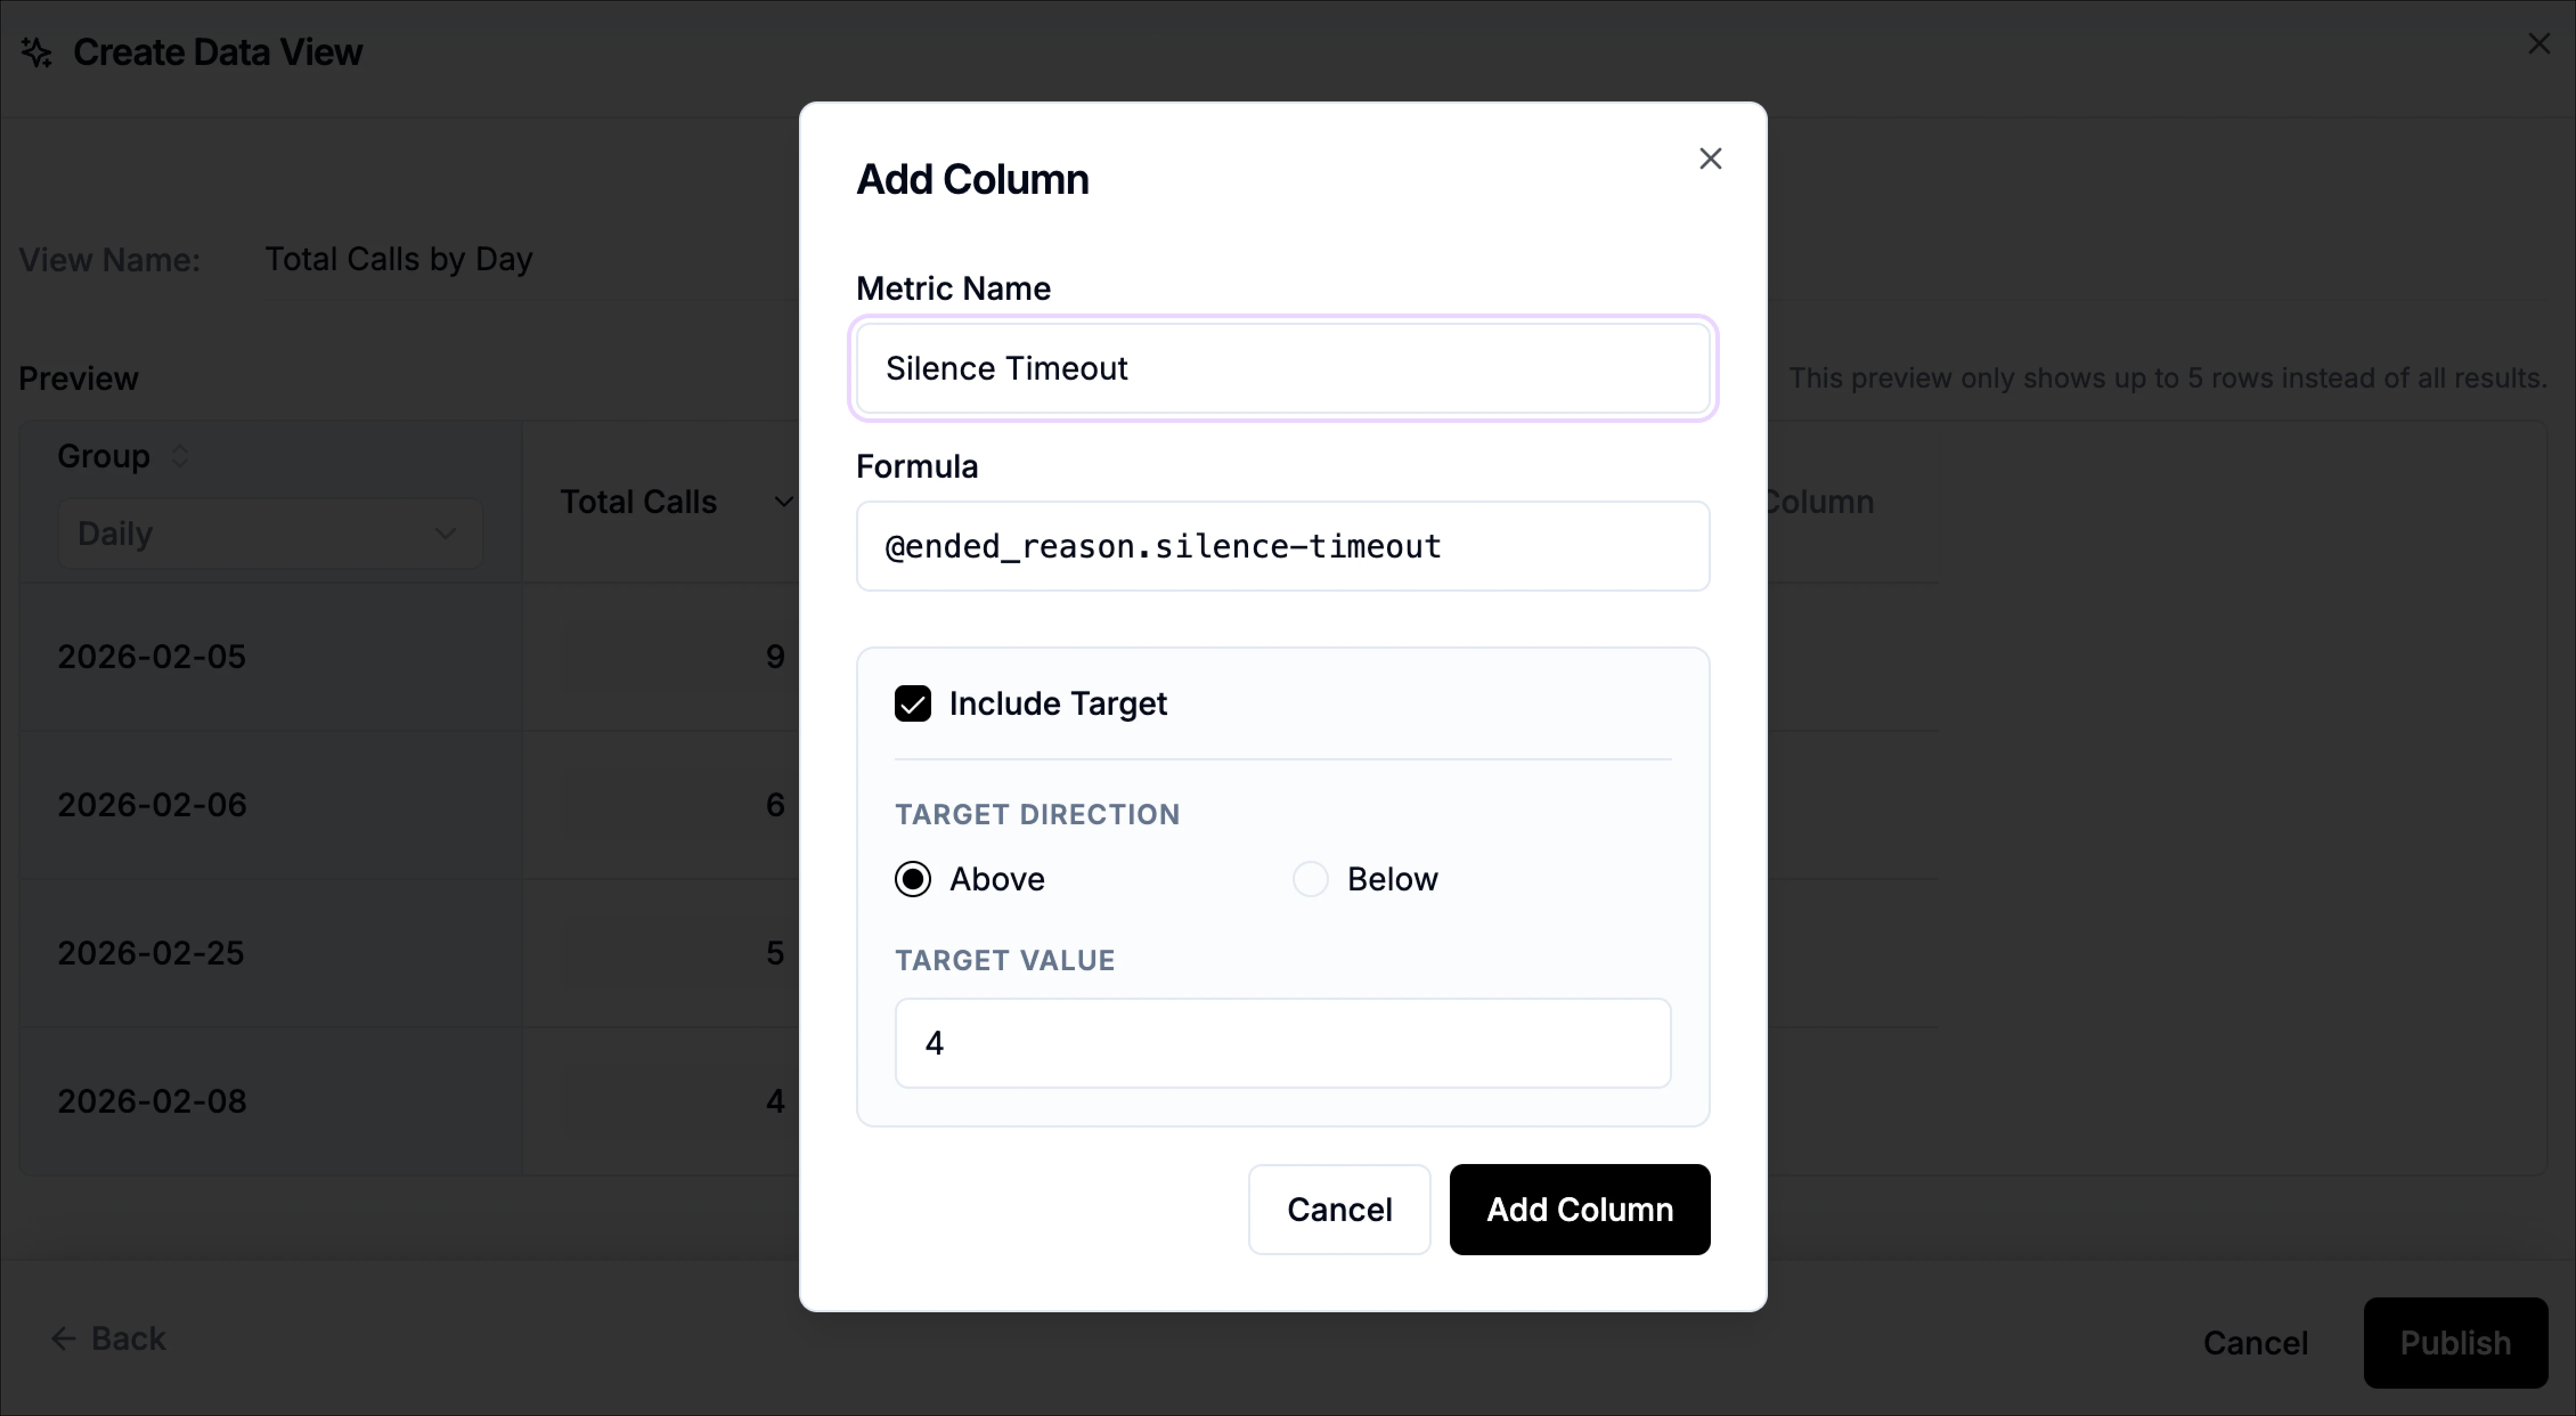
Target value
The target value is the numeric threshold the metric is compared against. For example:- if the metric is a percentage, the target might be
75 - if the metric is minutes, the target might be
4 - if the metric is a raw count, the target might be
20
- The metric is tied to a KPI
- The team already has a known goal
- You want to scan the table for rows that are off target
Add More Columns
You can continue adding more columns until the preview shows the exact combination of metrics you need. As you build, use the preview to confirm that both the grouping and the columns make sense together. If something looks off, you can change the grouping, update a metric, or go back and adjust the formula before publishing. When the view is ready, click Publish to save it. The new view will then appear as a tab in Data Tables, where you can switch to it anytime like any other saved view. If you decide not to keep the changes, click Cancel. If you want to return to the earlier setup step in the builder, use Back.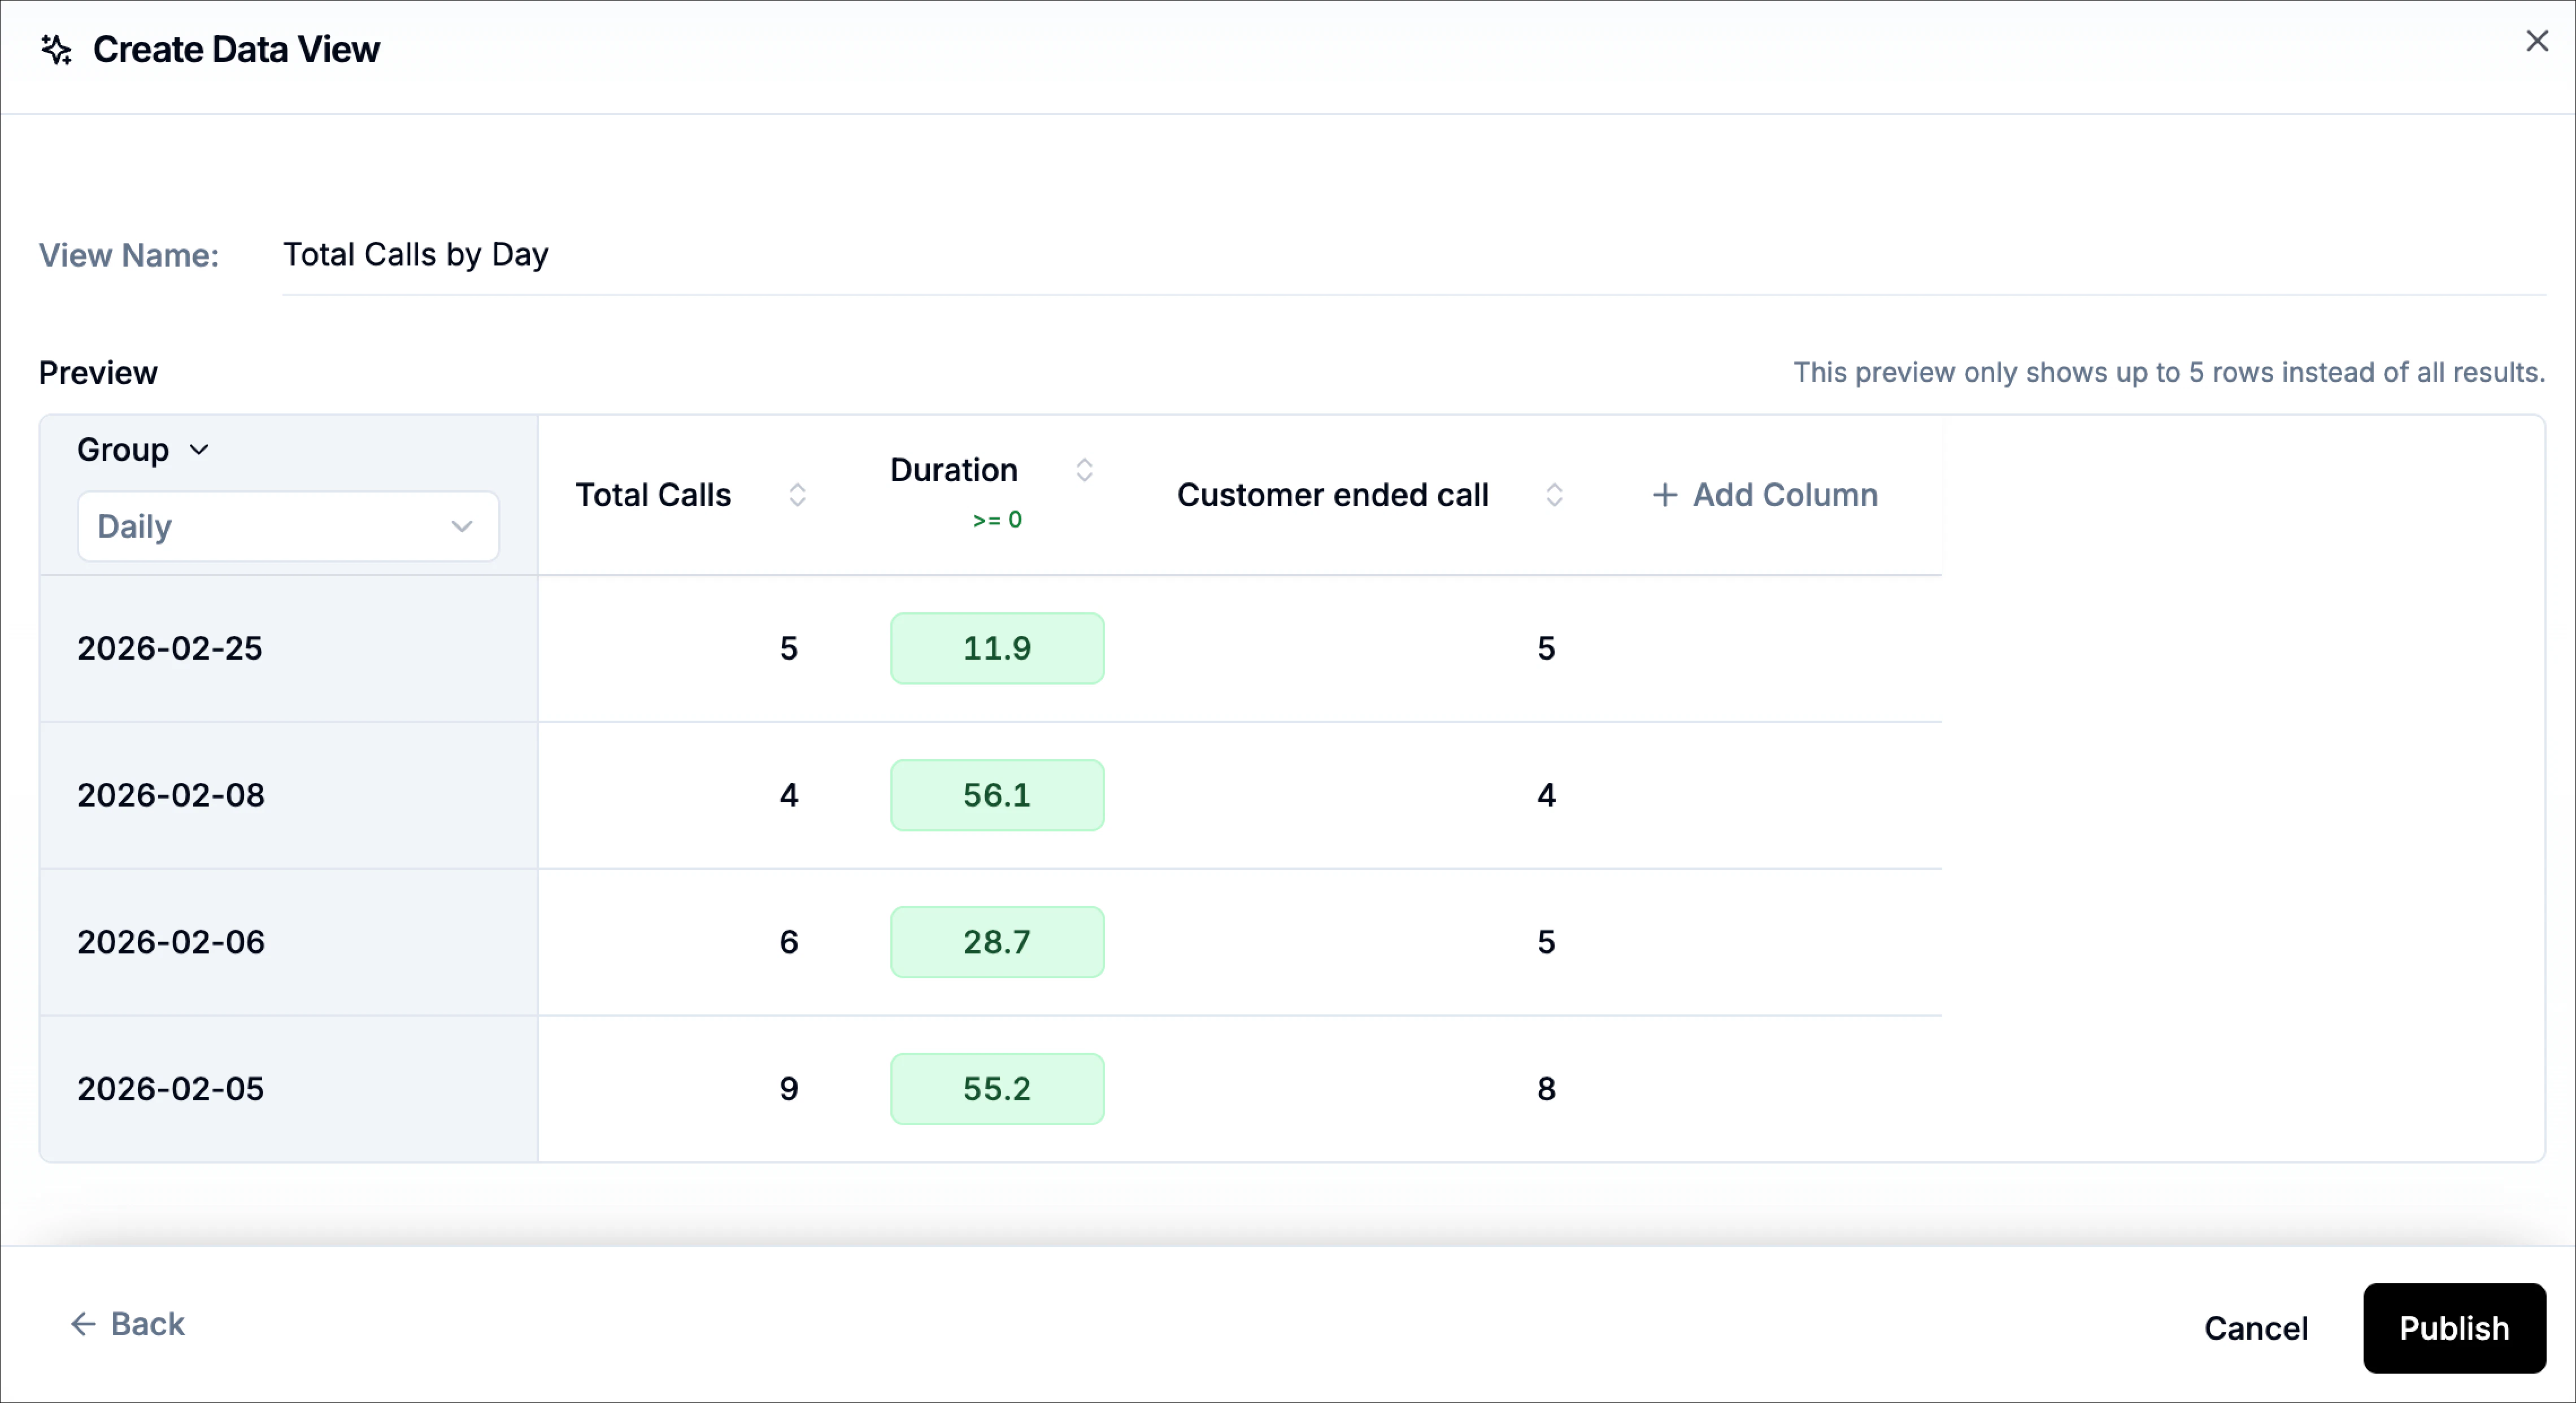
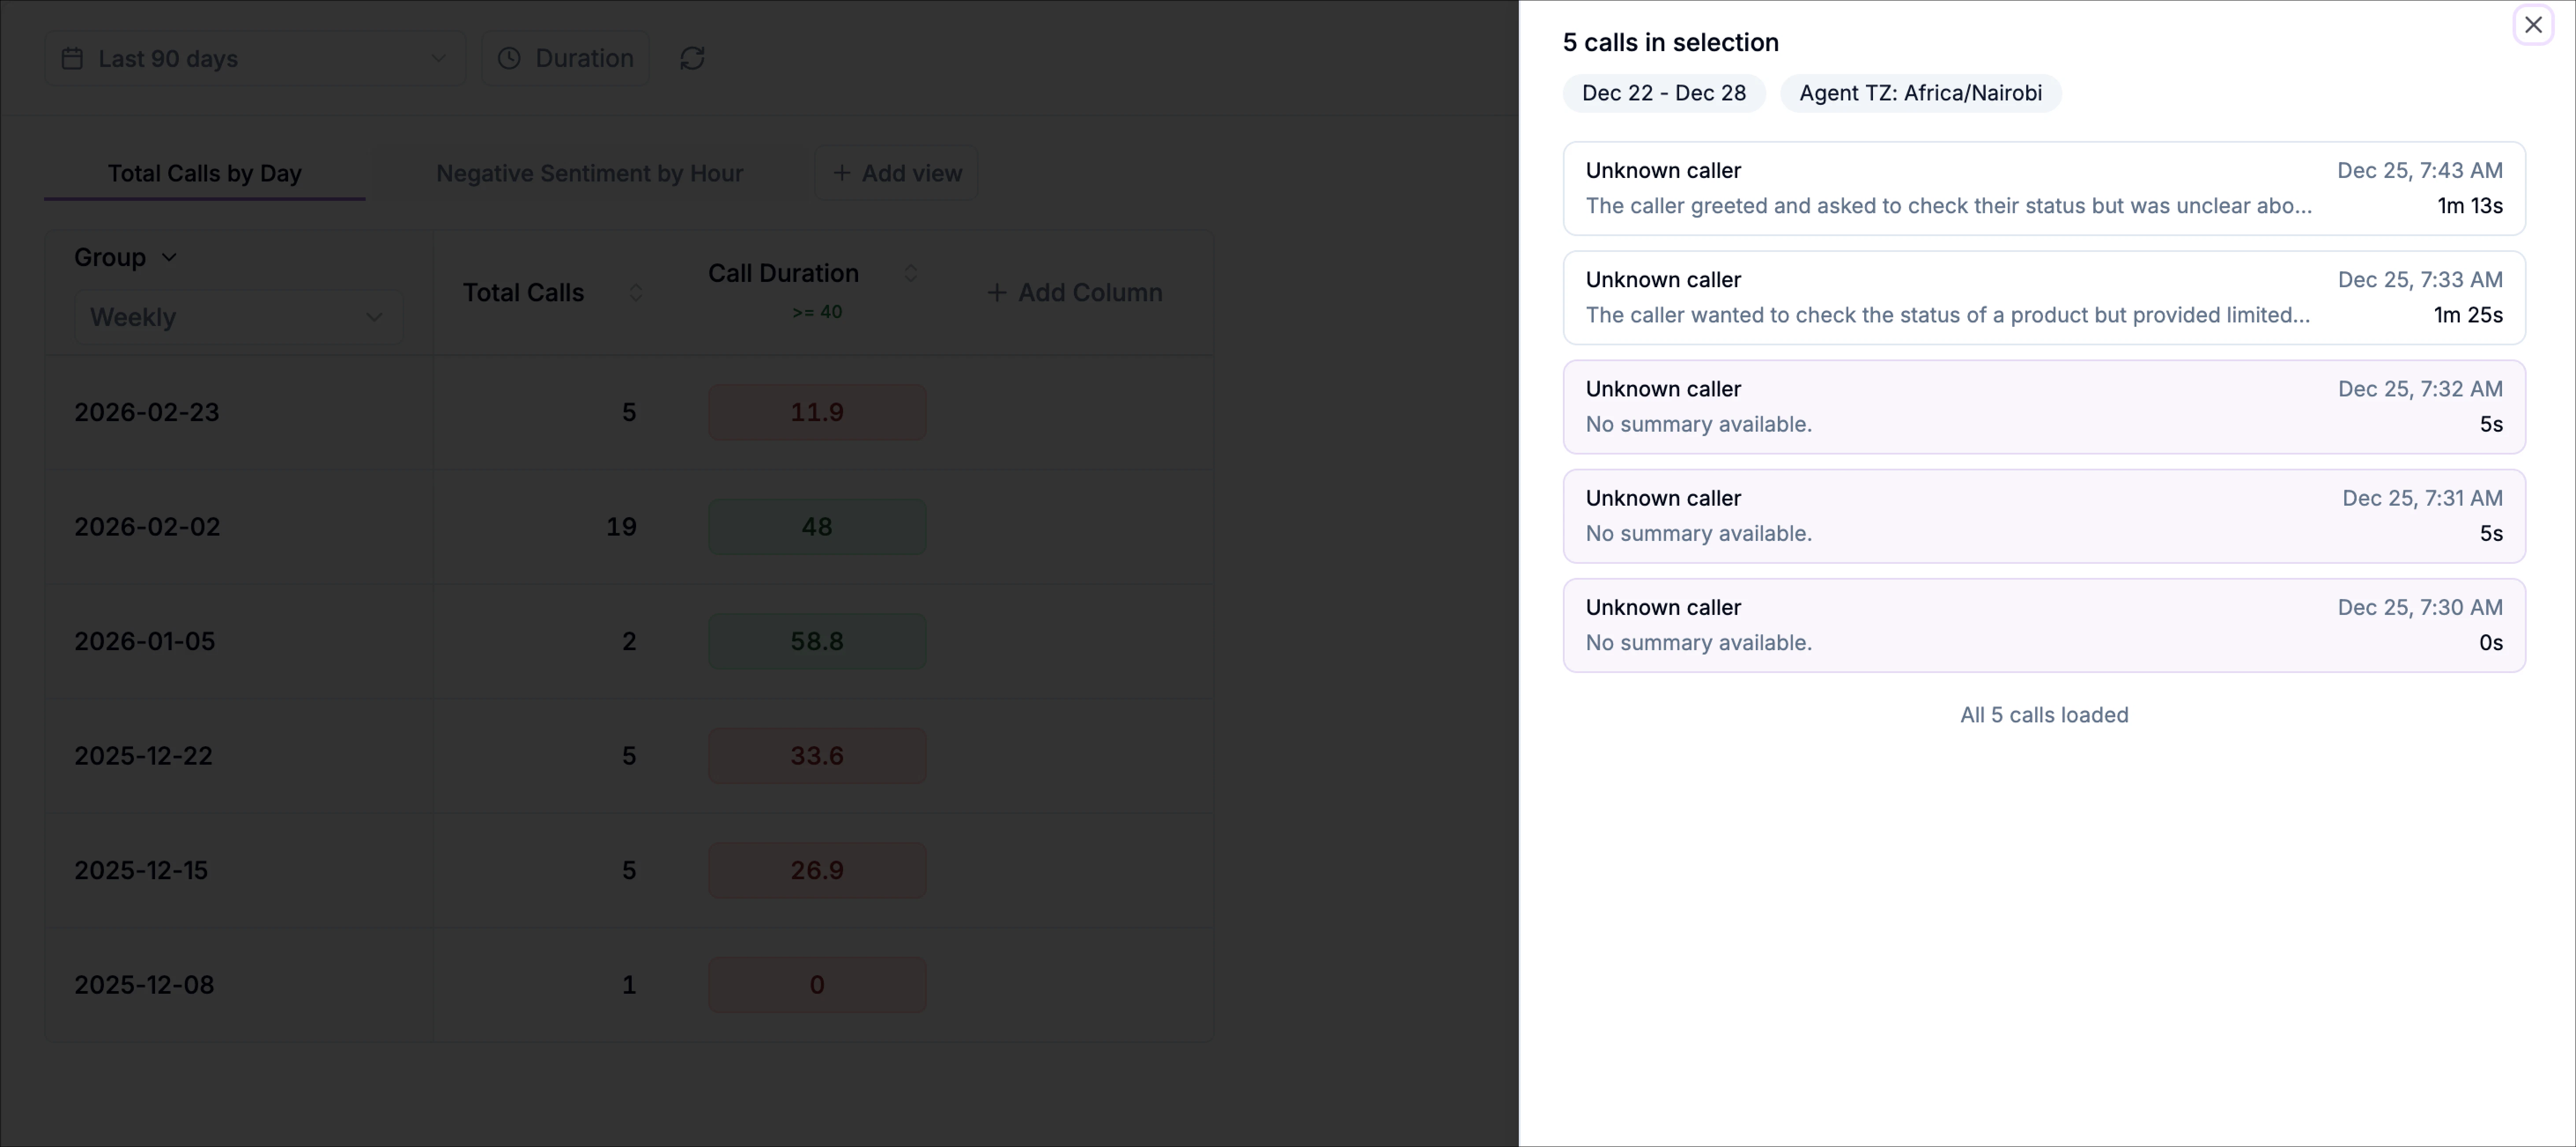
Drill-down on click
After you publish a data table view, you can drill into the calls behind any metric by clicking a cell in the table. This opens a call list panel showing the calls included in that value, along with a short summary, timestamp, and call duration, so you can quickly move from “the number” to the actual conversations that produced it. For ratio-based formulas (for example,(@sentiment.negative / @total) * 100), drill-down focuses on the numerator-side calls, the calls that contribute to the top part of the formula. This is intentional: it makes it easy to inspect exactly which calls drove the percentage, without forcing you to sift through every call in the denominator group.
- Validate that a metric is counting the right calls
- Investigate spikes or drops in a rate (success rate, negative sentiment rate, voicemail rate, etc.)
- Review the exact calls contributing to a specific outcome, topic, sentiment, or end reason